
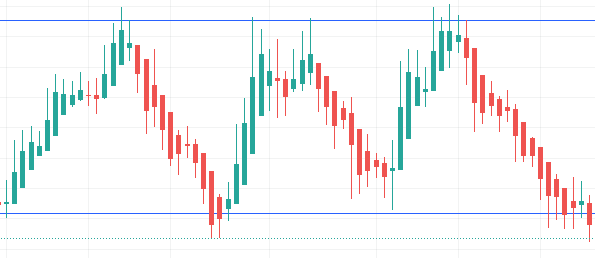
How to Trade Double Tops and Double Bottoms
The Double Pattern is pretty simple, as all of the moves associated with it just use two simple factors: Support…
Read More

Guide on How to Trade the Cup and Handle Pattern
The Cup and Handle pattern is one of the most commonly discussed chart patterns in the technical analysis world. The…
Read More
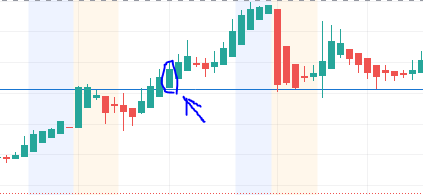
How to Trade Breakouts: Definitions, Strategies, Examples
A breakout in trading is when price moves above or below an area of support or resistance. They can be…
Read More
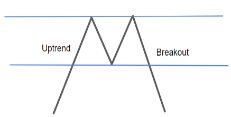
How to Trade the Diamond Pattern
The Diamond pattern is a very distinctive pattern that utilizes the concept of support and resistance. The pattern signals a…
Read More
What Is Technical Analysis? – Definitions, Strategies, Examples
Technical analysis is the method of applying chart analysis and examining movements in price. Technical analysts, those who focus and…
Read More
What Is Support and Resistance? A Complete Guide
Support and resistance levels are points of supply or demand of the stock. The concept of support and resistance is…
Read More
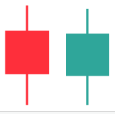
How to Read and Understand Candlesticks
Candlesticks are a Japanese invention thought to be developed by Munehisa Homma. Candles are used in technical analysis to identify…
Read More
How to Know What Type of Investor You Are
TYPES OF INVESTORS: Growth Investor Investors that buy into companies that are growing quicker than the stock market is growing,…
Read More

How To Predict Stock Movement: Support and Resistance
Sideways Price Action with Support and Resistance Lines (Also incline and decline trendlines in some areas) How Do You Predict…
Read More
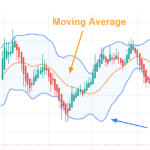
The Bollinger Bands® Indicator Makes Predicting the Stock Market Easy
Bollinger Bands® around price with arrows pointing to the upper band, lower band, and moving average Bollinger Bands This powerful…
Read More
How to Use the Most Powerful Stock Market Indicator (MACD)
Price action and Moving Average Convergence Divergence (MACD) Indicator Introduction to the MACD Now, “best” or “most powerful” is definitely…
Read More
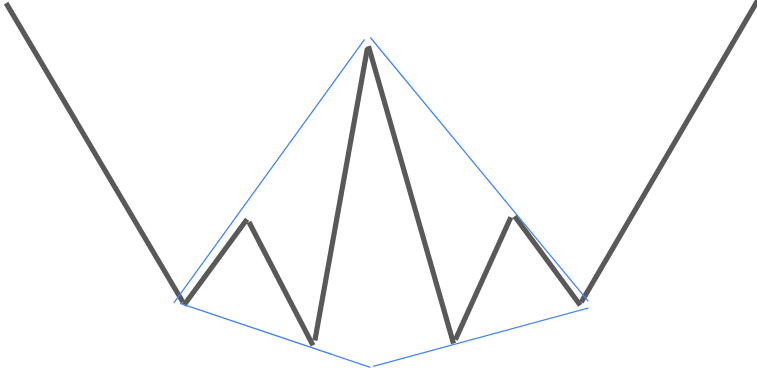
How to Trade Broadening Bottoms and Tops
A broadening bottom is bullish on the breakout and a broadening top is bearish on the breakout. This pattern is used…
Read More