
The Cup and Handle pattern is one of the most commonly discussed chart patterns in the technical analysis world. The pattern is called the Cup and Handle pattern because it resembles a cup with a handle.
According to Investopedia, American William J. O’Neil defined this pattern. There are different parts associated with it and the Cup part may look like a U shape. Sometimes, the pattern can be seen easily on a chart, and sometimes it can be a little tricky to spot.
Quick Notes:
- The Cup and Handle pattern has two main parts: The Cup, and the Handle.
- There are multiple possible buying and selling and shorting opportunities in the Cup and Handle pattern.
- Generally, traders like to avoid cups that have more of a V shape.
- The Inverted Cup and Handle pattern follows generally the same rules and rhythm as the other Cup and Handle pattern, but is inverse.
- The pattern is generally traded by swing traders, because it can take weeks and sometimes months to model.
How to Identify a Cup and Handle Pattern
A Cup and Handle pattern can be identified by marking the following parts: The cup, and the handle. It can start out with an uptrend or a downtrend. The parts, and pattern as a whole, are usually identified by technical analysts, who use candlesticks as a way to view stock price and movement. When it starts out with an uptrend, it may be a continuation sign of the uptrend, and when it starts out with a downtrend, it may be a reversal sign for the trend.
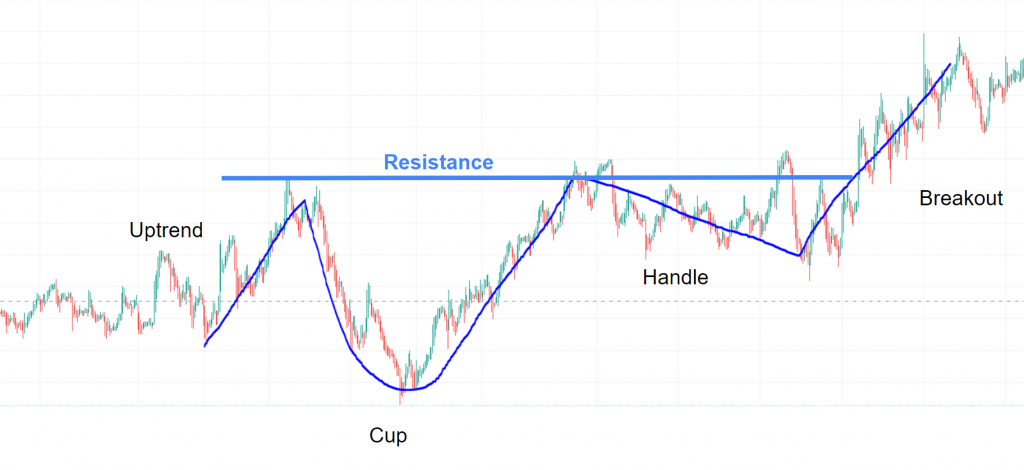
In this chart, we see that the price initially was trending up, until it hit some area of resistance and it started to form its cup phase.
The cup phase looks like a U, but it is not a super clean U.
After the cup phase, the handle part forms as the stock usually encounters an area of resistance. Sometimes it is the same level, and sometimes it is at a slightly different level. The handle can be equated to a pullback in the stock’s price.
Another reason the handle might form is that traders see that the stock has recovered from its fall and want to sell their shares, possibly because they don’t want to take the gamble on the rest of the cup and handle pattern.
Then, with the sellers diminished, the stock may run up and continue the bullish trend.
How to Trade the Cup and Handle Pattern
In the image above, there are multiple ways a trader may have approached the pattern. First, he or she may have suspected a Cup and Handle pattern and shorted or sold at the top of the Cup phase, the beginning. This is particularly risky because it is very hard to know if a Cup and Handle pattern is indeed forming.
The trader may also buy in the middle of the Cup phase and hope to ride the wave back up.
He or she may also short or sell at the Handle, as it is basically a pullback.
The trader may also attempt to predict the end of the Handle and the beginning of the breakout at the end, and buy into the breakout if the trader is bullish on the move.
The Inverted Cup and Handle Pattern
The Inverted Cup and Handle pattern is just like the Cup and Handle Pattern, but inverted. It doesn’t get as much recognition as the Cup and Handle pattern, but it does exist.
This pattern is if you take the original cup and handle pattern and just flipped it. So it is basically just an upside-down “U”.
To recognize and identify an Inverted Cup and Handle pattern, the trader must identify the parts of the pattern.
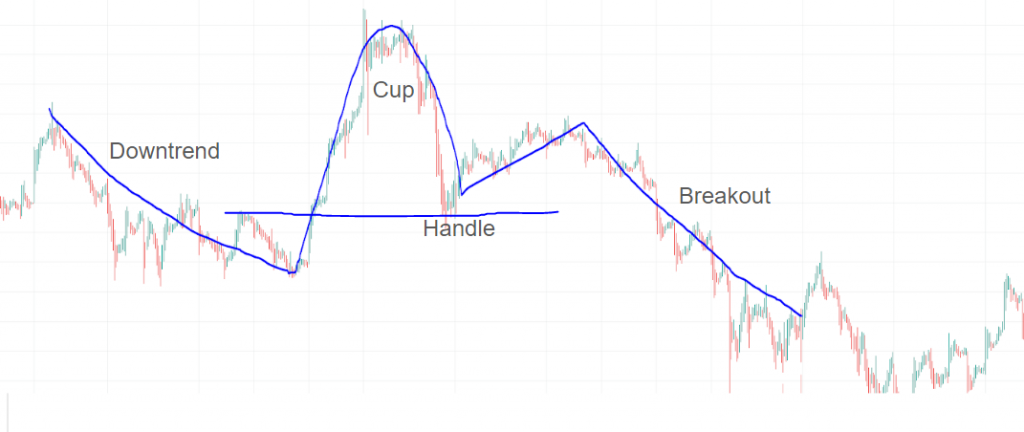
To start, there is the downtrend, then the Cup phase, then the Handle phase, and then the breakout that in this case, is bearish. A support line is also seen with the different phases in the image above.
How to Trade The Inverted Cup and Handle Pattern
Trading the chart pattern in the above picture is basically the same as the other Cup and Handle pattern. The trader may sell or short at the downtrend or buy at the beginning of the Cup phase, but those are both particularly risky.
He or she may also sell or short at the top of the Cup phase, or as it enters its bearish area of the Cup phase.
The trader may buy at the Handle phase and possibly short or sell at the breakout because in this case, it is a bearish breakout.
Where To Find Cup and Handle Pattern Charts
Most charting platforms have some type of candlestick feature, but here are some popular charting platforms:
TradingView
TradingView is one of the most popular online, free, and compact charting platforms. To view a stock with a candlestick chart, enter the stock’s name or ticker in the search bar and press enter. Then, press the button in the top left, next to the “Indicators” button that looks like this:

Then, press on “Candles”. Some may prefer to use the Heikin Ashi candles discussed above, as they may seem simpler.
Yahoo Finance
Another popular online charting software, powered by Yahoo. To access the candlestick chart, search up a ticker in the top search bar of the homepage, double click on the area chart, press the button that looks like this:

And choose “Candle”.
Stock Charts
Stock Charts may be a bit confusing for beginners, but it is very compact with features. To access a candlestick chart, search up a ticker in the search bar, and wallah, a candlestick chart has appeared. You can change the settings as you wish.
Thanks for your blog, nice to read. Do not stop.
Thank you, Mark. I’m glad you like it!
This actually answered my problem, thank you!
I simply wished to say thanks once again. I do not know the things I could possibly have created in the absence of the entire solutions shared by you concerning this field. It became an absolute intimidating concern in my circumstances, but witnessing your specialized approach you solved it made me to cry with happiness. Now i’m happy for this information and then hope that you really know what an amazing job that you are putting in training some other people via your site. Most probably you haven’t encountered any of us.
Thank you so much for the kind words!