
What Is Trading?
Trading is the buying and selling of financial assets such as stocks, forex, metals, etc. The term “trading” refers to this activity which is performed by someone or something called a trader. A trader is anyone or anything that is buying or selling a financial asset. Often, when someone uses the word “trader,” they are […]
Identifying Strong Supply and Demand Zones
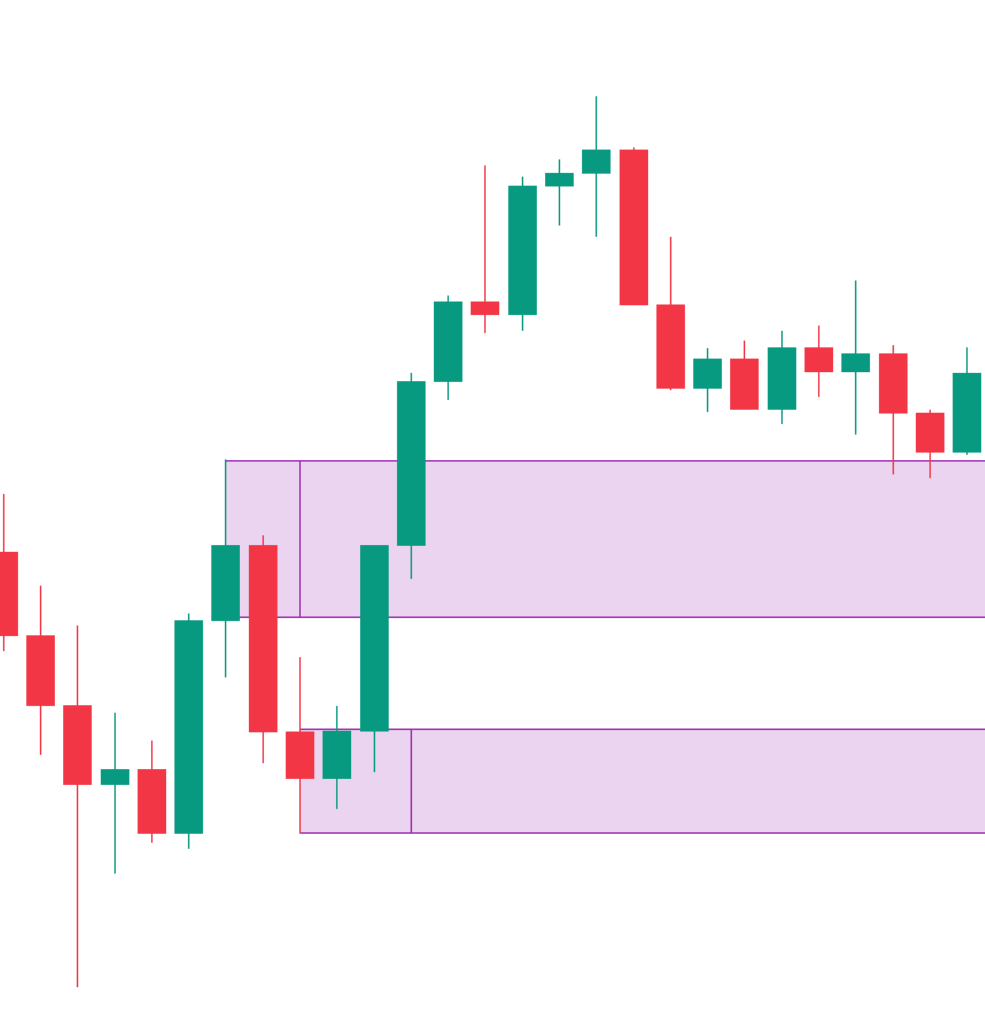
We often see new supply and demand traders mark out every zone and identify every imbalance on the chart. While this isn’t necessarily wrong technical analysis, it often leads to confusion and failed trades. This article will cover two ways of identifying possibly highly tradable supply and demand zones as opposed to zones that are […]
How to Use Moving Averages for Trading
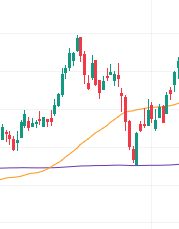
Moving averages (MAs), are one of the most well-known yet unused technical indicators. They are generally used to smooth out price data and show the average price, but there are several ways that they can be used for trading. Moving averages allow traders to employ many strategies, some of which are well-known and some of […]
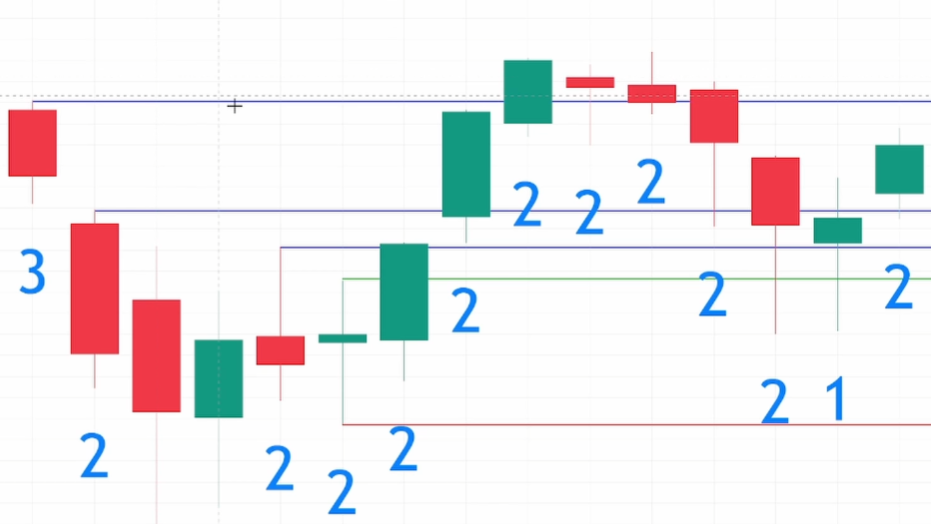
What Is the Pivot Machine Gun – STRAT Trading
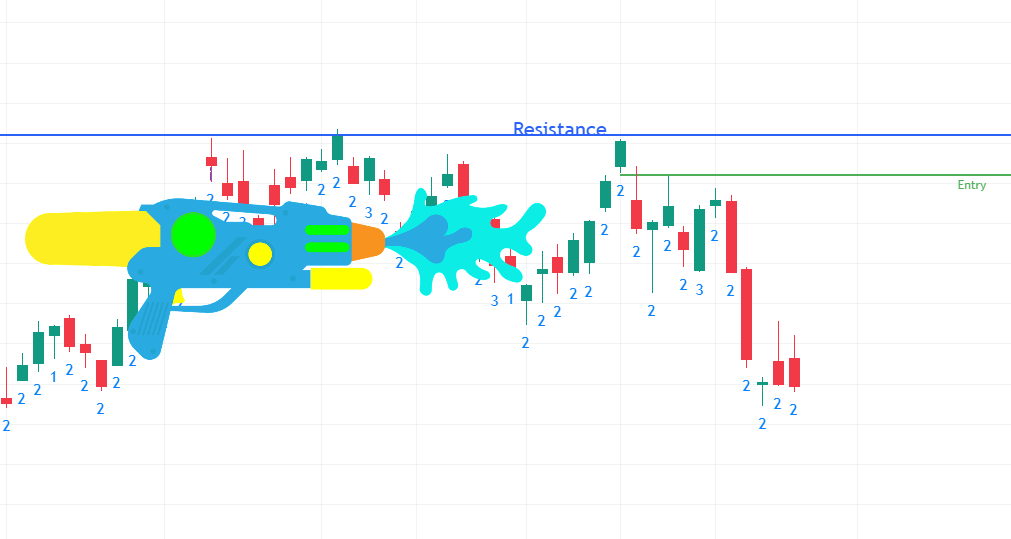
The Pivot Machine Gun (PMG), is a STRAT method strategy that is not very well known in the technical analysis world but also employs the chance of price rapidly increasing or decreasing in a short amount of time to profit. It works just like the other STRAT combos and it employs time frame continuity. STRAT […]
What Is a Stop-Loss? – Definitions and Examples
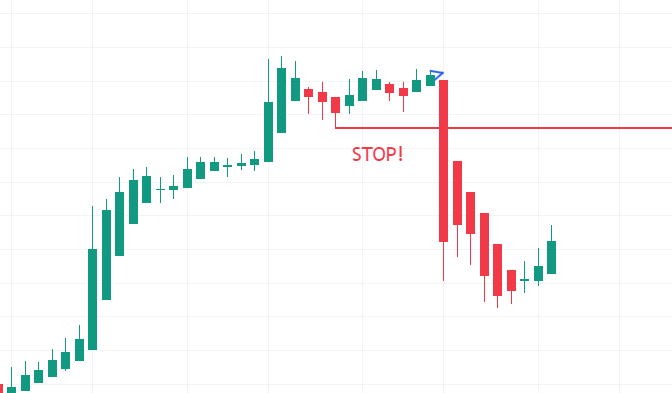
A stop-loss is a certain action that can be performed at a certain price to limit loss. It usually takes form as a selling action once an asset reaches a specific price. It not only helps traders stay disciplined but also ensures that traders follow part of a certain ruleset which may significantly prevent loss. Having […]
What Is the STRAT Method?
The STRAT method is possibly one of the most interesting stock market strategies there is. The STRAT method, developed by Rob Smith, is a price action-based charting strategy that analyzes individual candles and how they relate to each other, how they conform to levels of support and resistance, and how they can be traded with […]
How to Trade the Pipe Tops and Bottoms Chart Pattern
The Pipe Tops and Bottoms pattern uses individual candlesticks to determine possible trading opportunities, which can occur on both daily and weekly charts. Yet, Pipe patterns on a weekly chart generally perform better than those on a daily chart. It may seem similar to a Horn pattern as traders may execute trades based on levels […]
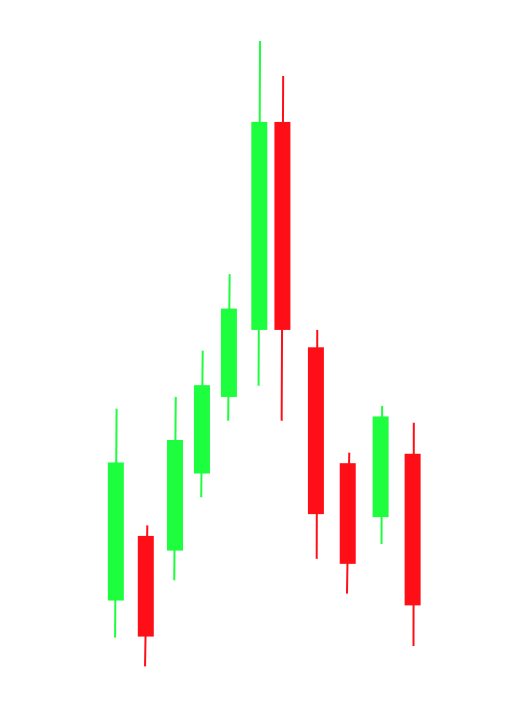
3 Popular Chart Patterns for Scalping
While there are many possible chart patterns and concepts that scalpers use to trade, these simple yet effective patterns that may be a scalper’s dream. Scalping is a certain trading style where traders specialize in making quick trades off small price changes. It uses the concept of support and resistance heavily and can incorporate indicators and chart […]
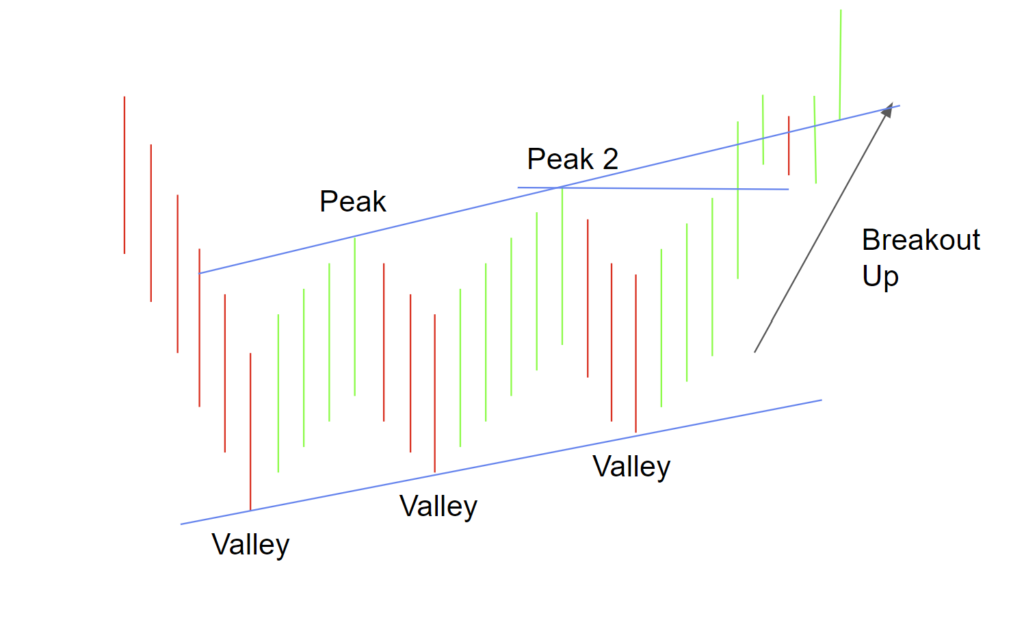
How to Trade the Three Rising Valleys Chart Pattern
Some traders may consider this pattern to be their favorite trend change pattern. Like the Three Falling Peaks pattern, the Three Rising Valleys (3RV) pattern is a breakout pattern. It is often seen in the stock market due to its simple identification, where the main part of the pattern is three valleys, each consecutive valley […]
How Much Money Do I Need to Trade Stocks?
The question is not how much money do you need, it is how much money should you start with? Well, the general rule is that you should only risk what you are willing to lose. The stock market is not a get-rich-quick game and losses will happen. That being said, check what your broker’s minimum […]