
A breakout in trading is when price moves above or below an area of support or resistance. They can be bullish or bearish and can indicate a possible trend in the breakout direction. Breakouts are sometimes referred to as trendline breaks, which will most likely be categorized as either ascending or descending.
Technical analysts often use chart patterns, indicators, and other strategies to try and predict a breakout. Trading breakouts is no easy task, but when done correctly may lead to major trading opportunities.
Quick Notes:
- A breakout is when price moves past a level of support or resistance.
- Traders may buy at the breakout, sell at the breakout, or short at the breakout.
- Traders often look for confirmation on the breakout, which often come in the form of candlesticks or volume.
- A failed breakout is common in the stock market world and a trader should be prepared to deal with it.
- Traders may be able to scan for chart patterns and other concepts in order to find potential breakout candidates.
What Is Support and Resistance?
Before learning about breakouts, one must understand the concept of support and resistance.
Support and resistance lines are price levels at which the stock tests, often multiple times. They are points of supply or demand of the stock. The concept of support and resistance is one of the most discussed topics in technical analysis and the stock market.
So, if a stock is bullish, and there is a resistance point, it may be paused and reverse or temporarily be paused. Conversely, if the stock is bearish, and there is a point of support, it may be paused temporarily or reverse.
There are multiple ways to trade support and resistance points, some of which you can read here.
How Do Traders Identify a Breakout?
With the vast number of topics and concepts in the stock market, and specifically technical analysis, how do traders identify breakout candidates and opportunities? Technical analysts may use chart patterns to identify possible breakout points.
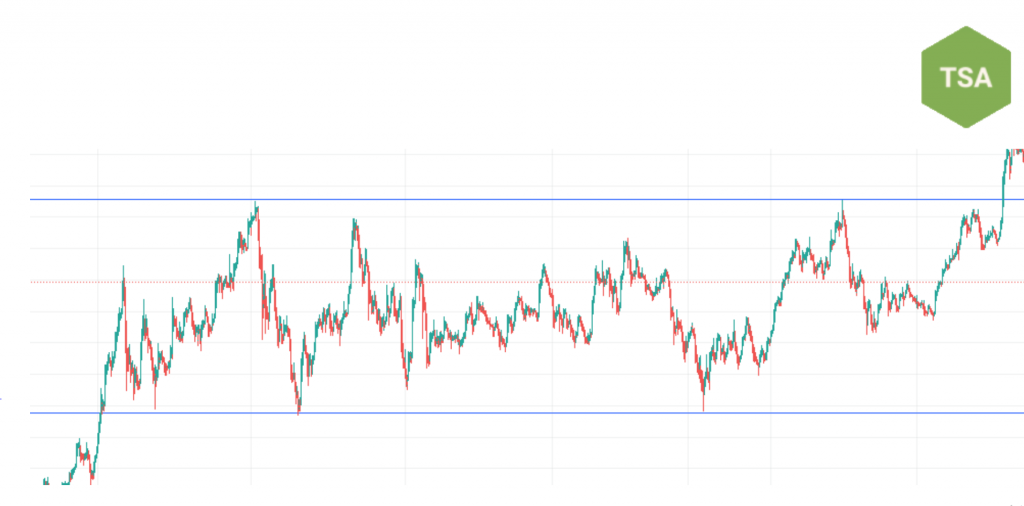
For example, let’s look at this chart here:
This chart uses the concept of support and resistance to identify a breakout opportunity. The top blue line starts out as an area of resistance, with the chart touching it multiple times, or testing it multiple times, but ultimately failing to completely pass.
So, a trader would see this testing occurring, and watch for a breakout as it moves closer to the resistance line. A trader may buy at multiple points in this chart, and we will get into how to trade a breakout soon.
As the chart begins to test the resistance line for the last time, it breaks through.
Here’s another example:
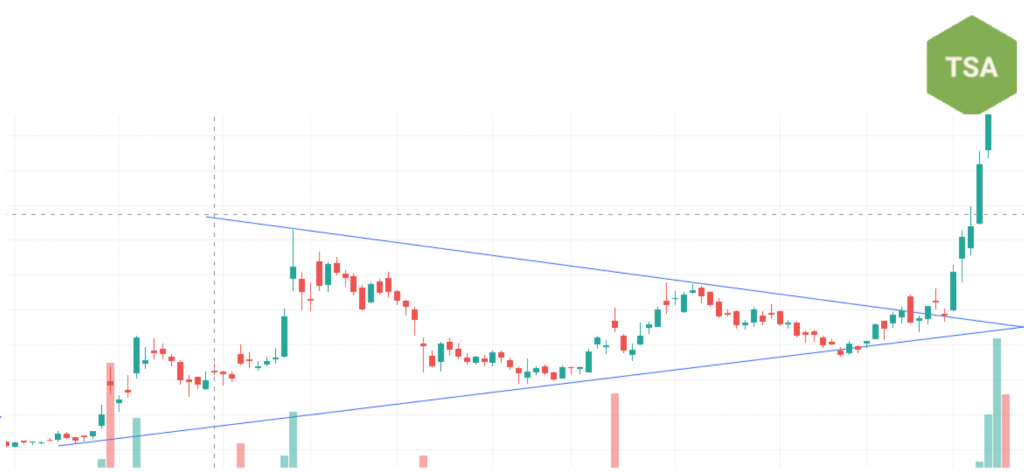
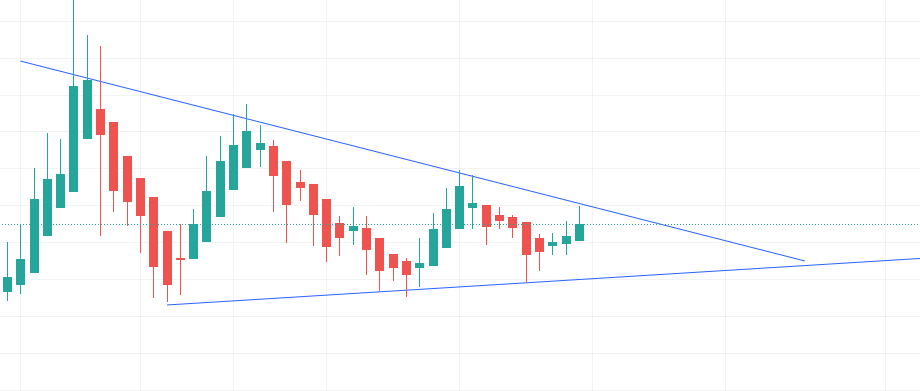
In this chart, we see that there is a line of support on the bottom, and resistance on the top. They are angeled toward each other and eventually will cross, forming a wedge pattern.
The stock’s chart gets tighter and tighter and eventually has nowhere to go except up or down. In this case, the chart performs a bullish breakout.
A trader may see this wedge forming and plan for a breakout in either direction.
How to Trade a Breakout
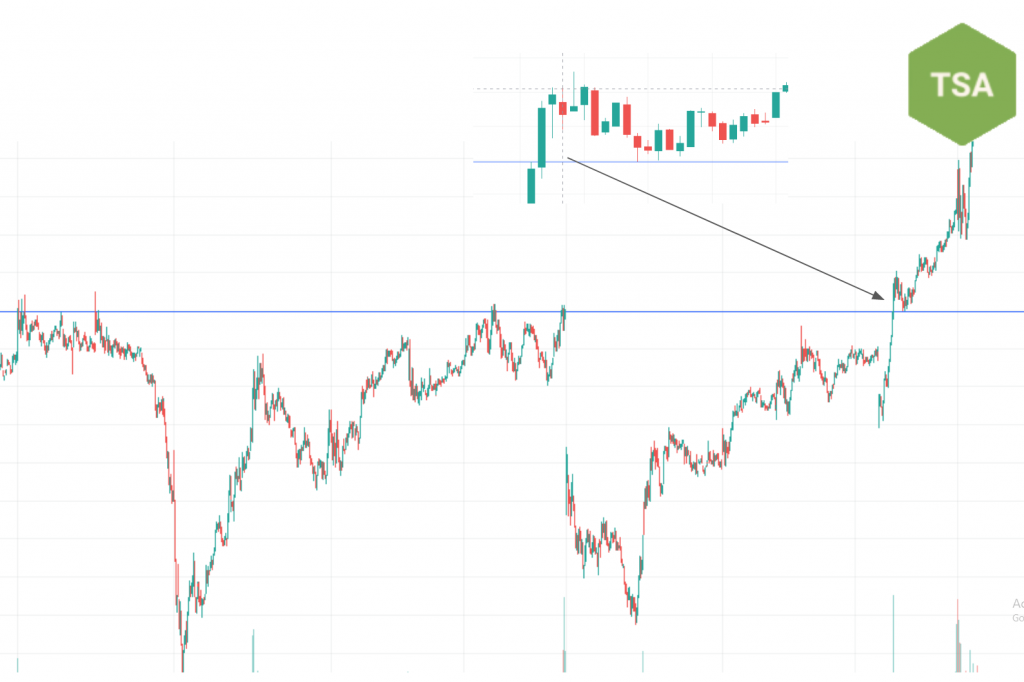
Now that you know some ways how traders identify breakouts, how do traders actually trade the breakout? Let’s take a look at this chart here:
In the beginning, the chart actually broke through the bottom line, which was resistance at the time, and formed this new trend. This beginning breakthrough made the bottom-line support.
The chart then forms this rectangle pattern, and the trader may recognize this and start looking for a potential breakout opportunity. As the chart nears either the support or the resistance line, the trader may be prepared for a possible breakout. As we can see, the chart ultimately breaks out up again.
There are multiple ways a trader could trade this. One way is to trade within the rectangle pattern. The trader may buy at the point of support and sell at the point of resistance. Or, the trader may short at the resistance level and cover at the support level.
If the trader buys at the support level, he/she may look to stay in and hope for a bullish breakout, to maximize his or her profits. So, the trader may buy at the point of support and sell during or after the breakout, or if there is no breakout, sell at the resistance level.
If the trader shorts at the resistance level, he/she may look for a bearish breakout.
While there are many chart patterns and other ways to identify breakouts, a popular one is a consolidation pattern.
Consolidation:
Consolidation is very popular, as a wedge pattern forms which forces the stock price to break out in a certain direction. Traders attempt to predict this direction and when the breakout will happen.
In this chart, the stock has a line of support on the bottom and a line of resistance on the top. The stock’s price is testing these lines multiple times, and it ultimately moves closer and closer and closer together. This is called consolidation.
The price moves so close together that it has nowhere else to go except up or down, and in this case, it moves down.
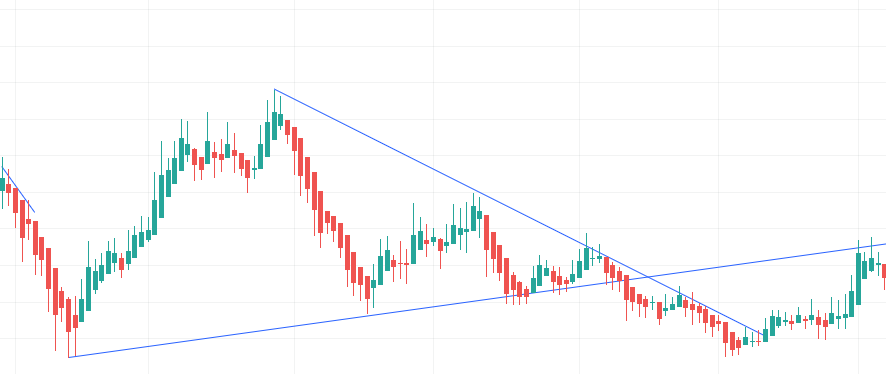
Let’s look at another example here:
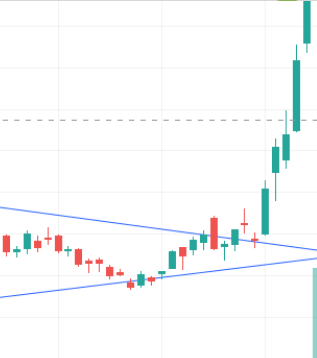
In this chart, we see a possible wedge pattern, with consolidation. The chart touches the lines of support and resistance multiple times, testing them. The chart may eventually break out bullish or bearish.
If the breakout is bullish, the trader may buy and if the breakout is bearish, the trader may short.
But how do traders know whether a stock’s breakout is bullish or bearish?
Confirmation:
Traders, when watching a potential breakout, usually have a way to distinguish a breakout from a test and a bounce. This is called confirmation.
The trader may look for confirmation on a potential breakout and it can depend on the trader.
Candlestick Confirmation
Confirmation usually involves a candlestick, or a part of a candlestick, crossing a line of support or resistance. The general strategy is to wait for a full candle body, or wait for the candle to close above a line of resistance or below a line of support as confirmation. This could generate a buy or sell or short point in the stock, as it may be a sign of a breakout.
In this chart, the green candle closes above the line of resistance as a wedge has formed. The chart then pulls back but does not move past the level, and eventually breaks out.
This closing strategy is one strategy for confirmation of a breakout. Although, the strategy that the trader uses is up to the comfortability of the trader.
Volume Confirmation
Using volume as confirmation is one of the best strategies to confirm a breakout. A surge in volume, as opposed to lower volume before it, may provide confirmation for the breakout.
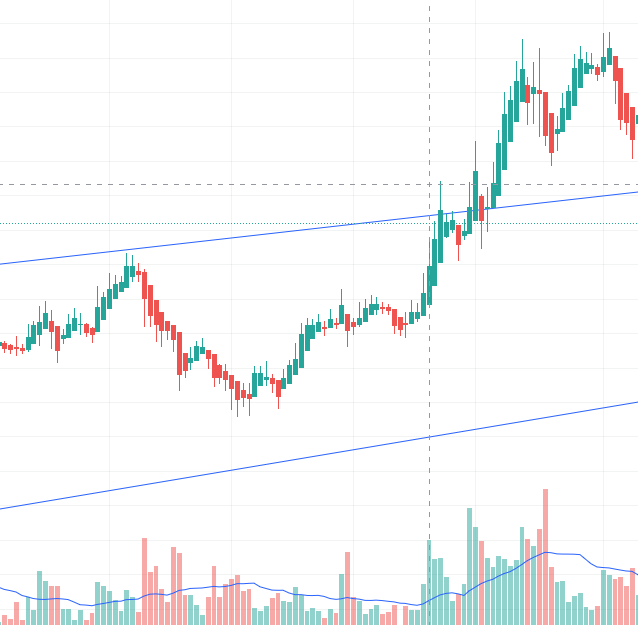
In this chart, volume spiked as the breakout was occurring. A green candle closes above the top resistance line and the volume is higher than usual on the indicator. The moving average may help traders see and analyze the different levels in volume.
The Pullback:
In the chart above, we see a small pullback after the green candle closes above the resistance line. This pullback is very common in breakouts.
A pullback is when the stock reverses to meet or almost meet, the level of support or resistance line. The pullback does not have to touch the line of support or resistance, but it should not fully cross it, almost as if it was an opposite breakout, or if it was moving back into the original pattern. This is one risk as a pullback may actually be a failed breakout.
Failed Breakouts
Failed breakouts are tricky because there is always a risk with a breakout. A failed breakout can be a nightmare for a trader because it can be hard to recover from and trade. That is why it is important to understand confirmation.
The Pattern Day Trading Rule
The Pattern Day Trading Rule is a regulatory rule that is often heavily enforced by brokers. It is for traders who perform four or more day trades within five business days under the same account. In order to day trade without this restriction, the trader must hold at least $25,000 in their margin account. In terms of breakouts, this can be particularly challenging for traders.
If the trader has less than $25,000 in their margin account, then recovering from a failed breakout, or a failed trade, in any case, may be more challenging because of the inability to get out quickly. This is why it is essential to plan for every part of the trade and to know chart patterns, indicators, and other strategies. Also, understand the risk before trading.
Using Indicators
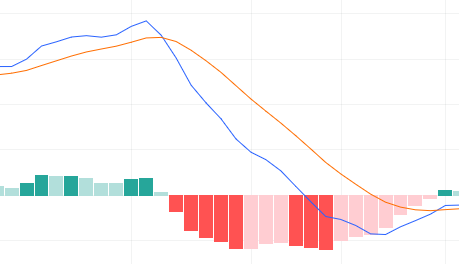
Indicators like the Moving Average Convergence Divergence (MACD) may be used to reinforce or confirm a breakout.
For example, if the MACD line is crossing from below to above the signal line, it may indicate bullish tendencies.
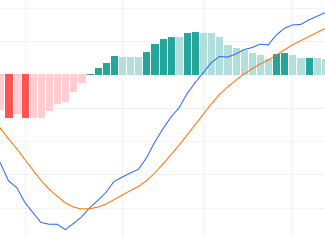
If the MACD line is crossing from above to below the signal line, it may indicate bearish tendencies.
What Chart Patterns to Scan For
While effective, traders may not have the time to search every stock for a wedge, or rectangle, or whatever pattern. This is where scanners come into play.
Scanners are a type of screening tool that searches stocks and other securities according to the trader’s criteria/ruleset. They are very useful in the stock market world. A free and powerful scanner can be found here.
As for the patterns to scan for, the general screened patterns are wedges, channels, flags, and rectangle chart patterns. Any patterns that can form a breakout are useful candidates.
Where To View Charts:
Most charting platforms have some type of candlestick feature, but here are some popular charting platforms:
TradingView
TradingView is one of the most popular online, free, and compact charting platforms. To view a stock with a candlestick chart, enter the stock’s name or ticker in the search bar and press enter. Then, press the button in the top left, next to the “Indicators” button that looks like this:

Then, press on “Candles”. Some may prefer to use the Heikin Ashi candles discussed above, as they may seem simpler.
Yahoo Finance
Another popular online charting software, powered by Yahoo. To access the candlestick chart, search up a ticker in the top search bar of the homepage, double click on the area chart, press the button that looks like this:

And choose “Candle”.
Stock Charts
Stock Charts may be a bit confusing for beginners, but it is very compact with features. To access a candlestick chart, search up a ticker in the search bar, and wallah, a candlestick chart has appeared. You can change the settings as you wish.