
The Double Pattern is pretty simple, as all of the moves associated with it just use two simple factors: Support and resistance. The Double Pattern is a fairly common pattern when it comes to technical analysis as it can indicate a potential reversal of the trend.
If you can master recognizing support and resistance points on the chart, you can see double bottoms and double tops.
Quick Notes:
- The Double Bottom and Top patterns utilize the concept of support and resistance to form their peaks and troughs.
- They are often described as reversal patterns.
- There are many points to possibly buy and sell in the patterns.
How to Identify Double Top and Double Bottom Patterns
The Double Pattern is often called a reversal pattern, so it would generally be seen at market tops or market bottoms. Traders may label the pattern as a Double Top Reversal Pattern (for bullish to bearish reversals), or a Double Bottom Reversal Pattern (for bearish to bullish reversals).
What Is a Double Top?
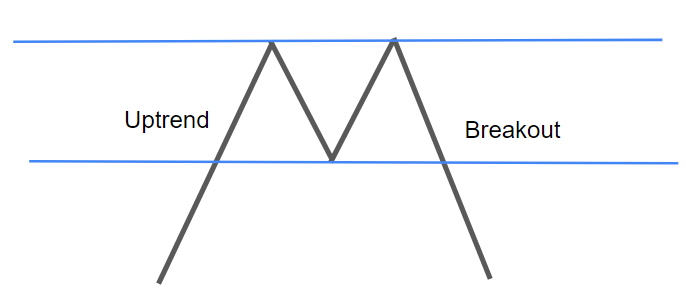
A diagram of the Double Top pattern is seen in the picture above. It starts out with an uptrend, then encounters an area of significant resistance (the top blue line).
After testing and bouncing off this top resistance line, the chart moves down and tests this bottom blue line, which is a level of support. The chart then bounces off of this level and hits the top resistance line again.
After bouncing off of the top resistance line, the chart comes back down to meet the support line, except in this case it breaks through the line. This breakout forms a downtrend which is sometimes categorized as a reversal.
It is named a Double Top pattern because the stock’s price tests the top resistance line twice, creating two tops.
This is generally how a Double Top looks and acts.
What Is a Double Bottom?
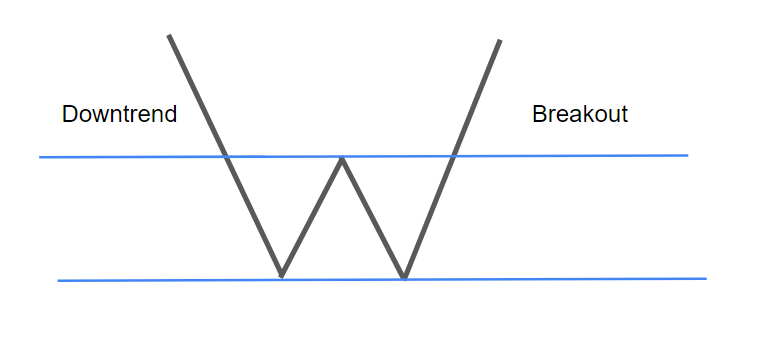
A diagram of the Double Bottom pattern is seen in the picture above. It starts out with a downtrend, then it encounters an area of significant support (the bottom blue line).
After testing and bouncing off this bottom support line, the chart moves up and tests this top blue line, which is a level of resistance. The chart then bounces off of this level and hits the bottom support line again.
After bouncing off of the bottom support line, the chart comes back up to meet the resistance line, except in this case it breaks through the line. This breakout forms an uptrend which is sometimes categorized as a reversal.
It is named a Double Bottom pattern because the stock’s price tests the bottom support line twice, creating two bottoms.
This is generally how a Double Bottom looks and acts.
How to Trade Double Top and Double Bottom Patterns
The Double Pattern does use support and resistance as its foundation and because it is a reversal pattern, traders can plan for a possible reversal in the trend.
Trade Double Top
The Double Top pattern starts out with an uptrend, so a trader may buy at the uptrend and/or plan to sell or short as it hits a significant point of resistance. This is particularly risky because of the lack of confirmation that it is indeed a Double Top.
Inside the pattern, the trader may also buy at the support line.
The trader can also short at the resistance line and hope for a bearish reversal/breakout.
Trade Double Bottom
The Double Bottom pattern starts out with a downtrend, so a trader may sell or short at the downtrend and/or plan to buy as it hits a significant point of support. This is particularly risky because of the lack of confirmation that it is indeed a Double Bottom.
Inside the pattern, the trader may sell at the resistance line what he or she may have bought at the bottom support line, or short from the resistance line and cover at the bottom support line.
The trader can also buy at the support line and hope for a bullish reversal/breakout.
Overall, mastering the concept of support and resistance may greatly improve not only Double Bottom and Top trading results, but may improve results with trading all patterns.
Example of a Double Top
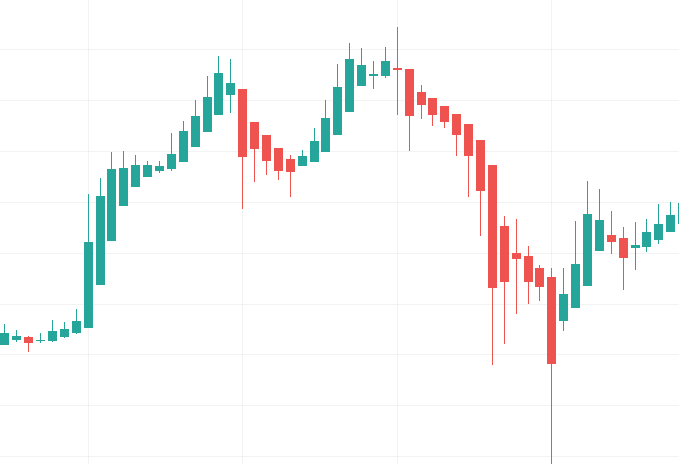
This pattern in the picture above may be categorized by some traders as a Double Top. We have an uptrend, then the first major peak of the pattern, a bounce to a bottom support level, then the second major peak, then finally a reversal.
Example of a Double Bottom
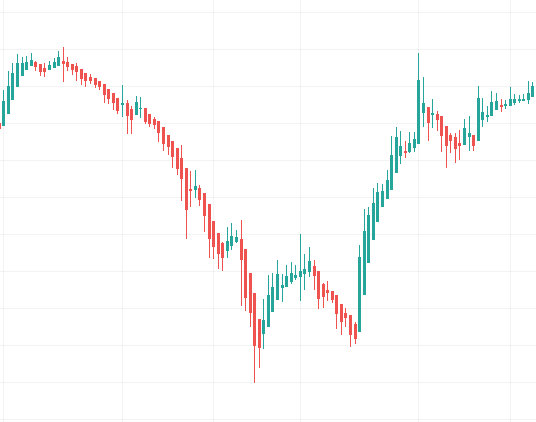
This pattern could be categorized by some as a Double Bottom pattern, because there is a downtrend, with two major bottoms, then an uptrend at the end as the reversal. There is even a resistance level that the chart bounces off of once.
In these patterns, wicks generated from the candlestick chart can make Double Patterns harder to recognize, but the overall structure is apparent.
Where To View Charts:
Most charting platforms have some type of candlestick feature, but here are some popular charting platforms:
TradingView
TradingView is one of the most popular online, free, and compact charting platforms. To view a stock with a candlestick chart, enter the stock’s name or ticker in the search bar and press enter. Then, press the button in the top left, next to the “Indicators” button that looks like this:

Then, press on “Candles”. Some may prefer to use the Heikin Ashi candles discussed above, as they may seem simpler.
Yahoo Finance
Another popular online charting software, powered by Yahoo. To access the candlestick chart, search up a ticker in the top search bar of the homepage, double click on the area chart, press the button that looks like this:

And choose “Candle”.
Stock Charts
Stock Charts may be a bit confusing for beginners, but it is very compact with features. To access a candlestick chart, search up a ticker in the search bar, and wallah, a candlestick chart has appeared. You can change the settings as you wish.