
How Do You Predict the Future of the Stock Market?
Is accurately predicting the future of the stock market 100% of the time a possibility? Well no, it’s not. Still, certain strategies can increase the likelihood of an investor’s success.
Stock movement is constantly trying to be predicted by investors, traders, and software. There are several ways to do this, but one of the most popular strategies is something called technical analysis.
Also Read – Broadening Bottoms and Tops
What Is Technical Analysis?
Technical analysis is the method of identifying certain price points and opportunities based on a stock’s chart. It is usually used to solidify or boost a trader’s confidence in their position. So, a trader would introduce chart analysis into their arsenal of trading strategies.
There are many chart patterns that traders use to try and predict future stock movement. Some of these patterns are called the Double Bottom/Top, Broadening Pattern, the Cup and Handle Pattern, the Three Falling Peaks Pattern, and many, many more.
Almost all of the patterns in the stock market can be attributed to lines of support and resistance. But what is support and resistance, and why is it important?
What Is Support and Resistance?
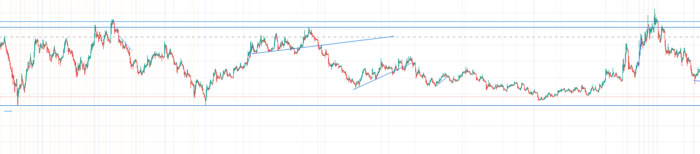
Support and resistance lines are price levels at which the stock tests, often multiple times. How do we identify these points? Just look at the chart:
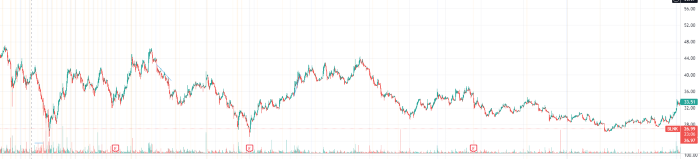
In the picture above, price touches the bottom level a few times. It also touches the top level a few times. It may be a little hard to see so let’s draw some lines:
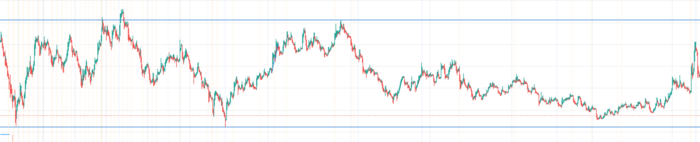
The line on the bottom acts as a point of support for the chart (almost like a floor), which stops the stock and bounces it the other way when it touches it. The same thing happens at the top line called a resistance line (almost like a ceiling), which stops the stock at the top.
Also Read – How to Use Candlesticks and Why You Should
How to Trade Support and Resistance Points
There are multiple ways to use support and resistance as an advantage in trading. One is being able to recognize other chart patterns like a Double Bottom with it. Another is to trade using a few simple strategies.
Trading Between The Points:
Trading between lines of support and resistance is a strategy often used by many professional charters. A trader may buy into the stock at the point of support and hold it until the point of resistance, then sell it there. The trader may also short it at the resistance price point, and wait for it to fall to the support line, (or lower), then cover it there.
Breakouts:
Support and resistance points are crucial to know if one wants to trade breakouts. A breakout occurs when a candle closes above the point of resistance or below the point of support on a chart. Let’s look at this picture here:
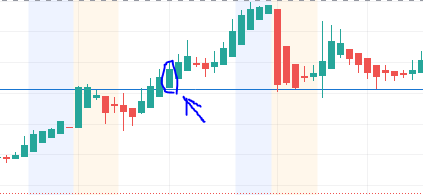
This chart shows the full candle body (circled in blue), closing above the resistance (blue), line. After that, a breakout occurs.
A trader may play this in a few ways. A trader may buy at the bottom support line, then hold it to the resistance line and hope for a breakout. If the breakout occurs, the trader may play the breakout. If a breakout doesn’t occur, the trader may still sell at the resistance price point, or hold it and maybe even buy some more if the stock lowers in price and possibly if it hits the support line.
A trader may do the opposite if shorting. If a trader shorts at the resistance line, he/she may short it until the support line and hope for a breakout down. If it breakout down, AKA a bullish breakout, he/she may play the breakout. If not, the trader may cover their position there, wait until it increases in price, and short some more.
There are multiple ways to use support and resistance to maximize trading potential.