
The Diamond pattern is a very distinctive pattern that utilizes the concept of support and resistance. The pattern signals a reversal of the current trend as it is very similar to a Head and Shoulders pattern.
If analyzed correctly, many trading opportunities may arise during and after the pattern.
Quick Notes:
- When marked out with support and resistance trend lines, the pattern forms a shape of a diamond.
- It may be confused with a Head and Shoulders pattern, and the trader should take caution to correctly identify the pattern.
- A breakout may be calculated by taking the distance between the highest and lowest points and adding it where the breakout occurs.
The Diamond Pattern
Not to be confused with the Double pattern, a Diamond pattern looks like this:
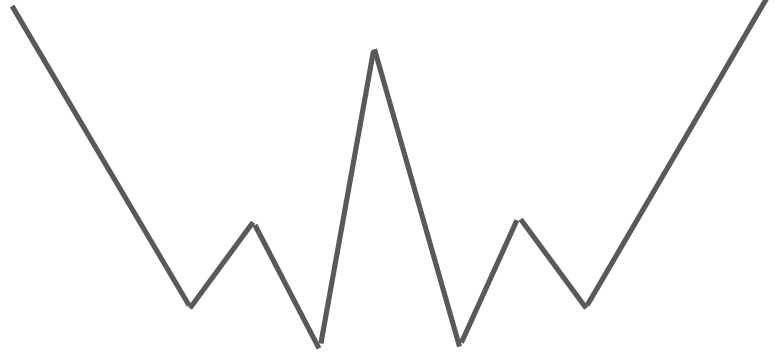
The pattern at first does not look like a diamond, but by adding support and resistance lines to the chart, it forms the shape of a diamond.
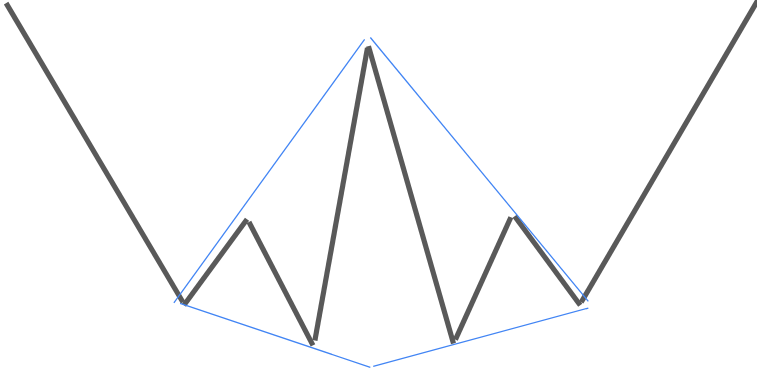
The support and resistance trend lines show a diamond shape. There are two types of Diamond patterns, the Diamond Top, and the Diamond Bottom.
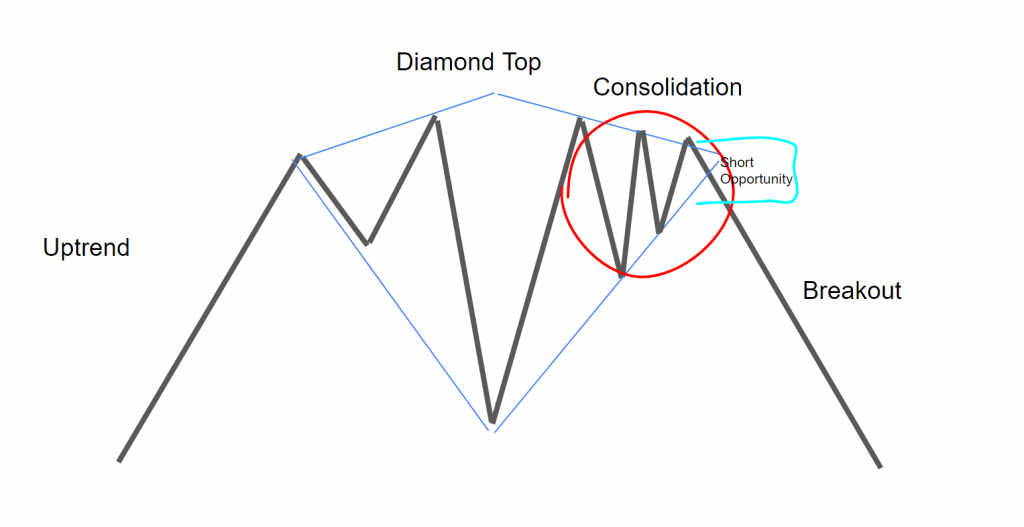
Diamond Top
The Diamond Top pattern is more common than the Diamond Bottom pattern, and it occurs at market tops. It can signal a bearish reversal of the trend because it starts with an uptrend which can lead to large trading opportunities.
How to Trade the Diamond Top
The diamond top has the uptrend, then the diamond top part, then the consolidation, and then an opportunity to short, because the chart, in the definition of a diamond top, will most likely breakout down. Investors usually wait for confirmation on any breakout, as anything can always happen.
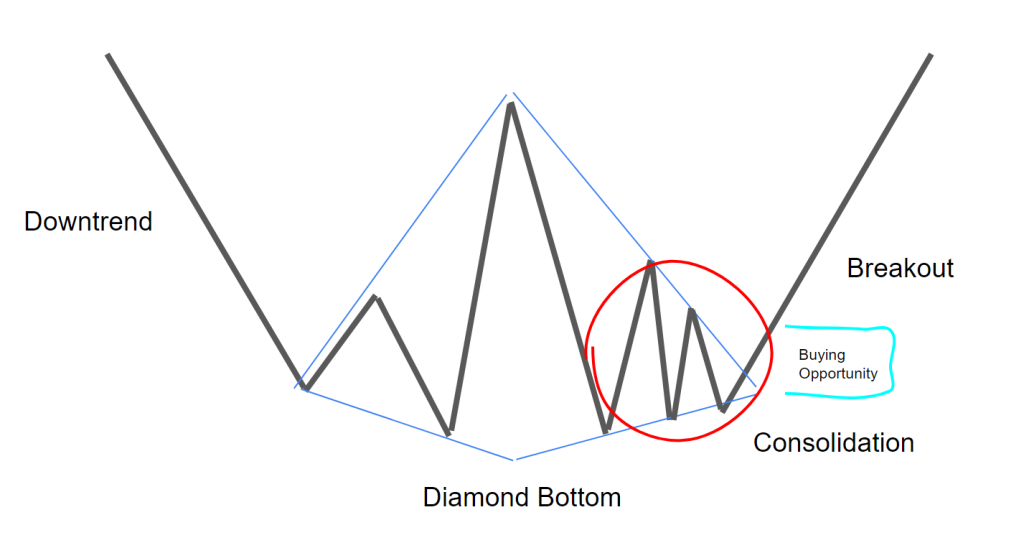
Diamond Bottom
While rare, a Diamond Bottom can occur at market bottoms. It is a bullish reversal pattern, because it starts with a downtrend, forms the diamond, and then has a chance of reversal.
How to Trade the Diamond Bottom
As price consolidates and either breaks out down or up. In this case, the consolidation leads to a breakout that is bullish. So to go over the steps: the diamond bottom begins with a downtrend, then creates the actual diamond part, then usually consolidation, then a breakout that is either bullish or bearish.
The Diamond Pattern VS The Head and Shoulders Pattern
One difference is that price tends to consolidate before a breakout on the Diamond pattern.
By sight, the Diamond pattern may look like a lopsided Head and Shoulders pattern.
Also, a Diamond pattern may result in a trend being broken sooner than a Head and Shoulder would break a trend.
Calculating a Breakout
Many technical analysts advise that to calculate a breakout from the Diamond pattern, the trader should take the distance between the highest point and the lowest point in the pattern.
Then, take this number and add it to the breakout point. This may calculate the possible distance of the breakout.
Where To View Charts:
Most charting platforms have some type of candlestick feature, but here are some popular charting platforms:
TradingView
TradingView is one of the most popular online, free, and compact charting platforms. To view a stock with a candlestick chart, enter the stock’s name or ticker in the search bar and press enter. Then, press the button in the top left, next to the “Indicators” button that looks like this:

Then, press on “Candles”. Some may prefer to use the Heikin Ashi candles discussed above, as they may seem simpler.
Yahoo Finance
Another popular online charting software, powered by Yahoo. To access the candlestick chart, search up a ticker in the top search bar of the homepage, double click on the area chart, press the button that looks like this:

And choose “Candle”.
Stock Charts
Stock Charts may be a bit confusing for beginners, but it is very compact with features. To access a candlestick chart, search up a ticker in the search bar, and wallah, a candlestick chart has appeared. You can change the settings as you wish.