
A broadening bottom is bullish on the breakout and a broadening top is bearish on the breakout. This pattern is used by technical analysts, those who study technical analysis.
Quick Notes:
- A broadening bottom is bullish on the breakout.
- A broadening top is bearish on the breakout.
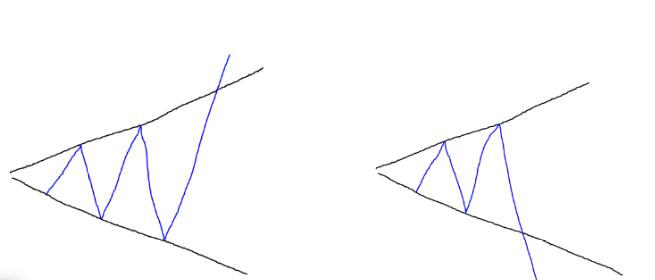
- The broadening pattern uses two main lines, one support, and one resistance.
- Broadening formations are a big part of technical analysis, often seen in trading strategies like the STRAT method.
Also Read – How to Read and Understand Candlesticks
The overall broadening pattern is bearish if it breaks below the bottom trend line or the bottom support line and it is bullish if it breaks through the top resistance line.
A broadening top may be more common because traders who are hanging on to the stock and watching it fluctuate want to take their profits, driving the price down even lower.
Or, as the broadening pattern goes on, there may be less and less certainty that it will continue because of traders taking profits.
Support and Resistance Lines in the Broadening Pattern
The broadening trend lines are where support and resistance come into play. The bottom being support and the top being resistance. As the chart bounces between these lines, creating higher highs and lower lows, either buyers or sellers may take control and force the stock down, or force the stock up.
Here is an actual example of a broadening pattern.
If it ends up being bearish on the breakout, it may be considered a broadening top.
The broadening pattern is often used by traders who trade technical analysis. Technical analysis experts usually use candlestick charts to view stocks.
The STRAT Method
Broadening formations are a universal principle of the STRAT method, developed by Rob Smith. He has a thesis that securities trade in series of higher highs and lower lows.
This method s a price action-based charting strategy that analyzes individual candles and how they relate to each other, how they conform to levels of support and resistance, and how they can be traded with other time frames.
A broadening formation may be identified by a 3 bar. Because the 3 bar takes out both the high and the low of the previous candle, it naturally expands price, or broadens price.
Broadening patterns often create distinct lines of support and resistance so they can be used to identify points of reversal in the trend.
If price is hitting a level of support, the trader may look for a bullish reversal combo, and if price is hitting a level of resistance, the trader may look for a bearish reversal combo.
Other parts of the STRAT method and all trading should also be considered, like time frame continuity.
Where to Find Candlestick Charts
Most charting platforms have some type of candlestick feature, but here are some popular charting platforms:
TradingView
TradingView is one of the most popular online, free, and compact charting platforms. To view a stock with a candlestick chart, enter the stock’s name or ticker in the search bar and press enter. Then, press the button in the top left, next to the “Indicators” button that looks like this:

Then, press on “Candles”. Some may prefer to use the Heikin Ashi candles, as they may seem simpler.
Yahoo Finance
Another popular online charting software, powered by Yahoo. To access the candlestick chart, search up a ticker in the top search bar of the homepage, double click on the area chart, press the button that looks like this:

And choose “Candle”.
Stock Charts
Stock Charts may be a bit confusing for beginners, but it is very compact with features. To access a candlestick chart, search up a ticker in the search bar, and wallah, a candlestick chart has appeared. You can change the settings as you wish.