
Introduction to the MACD
Now, “best” or “most powerful” is definitely subjective and this indicator does not always guarantee success. Yet, it is one of the most popular technical analysis indicators in the stock market world. The indicator is called the Moving Average Convergence Divergence, or MACD.
Quick Notes:
- The MACD stands for Moving Average Convergence Divergence.
- The MACD has three main parts: the MACD Line, the Signal Line, and the Histogram.
- It’s calculated by taking a 12-period exponential moving average and subtracting a 26-period moving average.
- The Histogram oscillates around a Zero-Line.
The MACD
It may look kind of complicated at first, but let’s start by breaking it down, part by part.
The MACD Line
The MACD line or the indicator line is calculated by taking a 12-period exponential moving average and subtracting a 26-period moving average.
The Signal Line
Taking the last nine values of the MACD line will calculate the Signal Line.
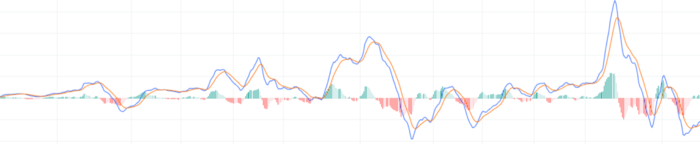
The Histogram
The histogram is the oscillator in the middle, often green and red, green for positive, and red for negative. It oscillates around the value of zero, at the Zero Line. The size of the bars depends on how far apart the signal and MACD line is because it takes the difference between the two lines.
MACD Indicator Strategies
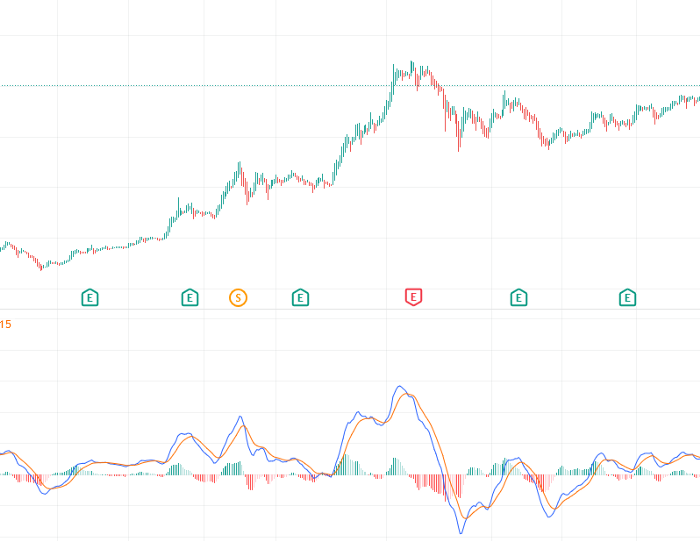
The most used strategy is most likely the line crossing strategy. Traders may try and predict or wait for the MACD and the signal line to cross and enter a trade that way. A strategy is if the MACD line crosses above the signal line, it may indicate an uptrend, and if the MACD line crosses below the Signal Line, it may indicate a downtrend. Although, many traders do not like this strategy because it is not very definitive as there may be many crosses at a given time as seen here.
This is one reason why many traders prefer to use the MACD in a trending market instead of a choppy or sideways market, but it still may happen in a trending market, so be careful of that. What some traders would then do, is establish a strong prediction with other indicators and patterns and knowledge and then use the MACD as another indication to support their position. For example, if the chart is hitting points of support and resistance, and consolidating, traders may use the MACD to identify a possible breakout. Let’s look at an example:
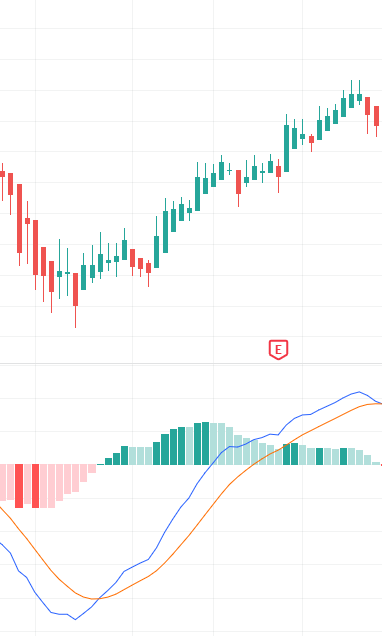
In this case, the MACD line is blue and the Signal line is orange. We can see that when price becomes bullish and starts to create an uptrend, the blue MACD line crosses above the orange Signal line.
Also Read – Broadening Bottoms and Tops
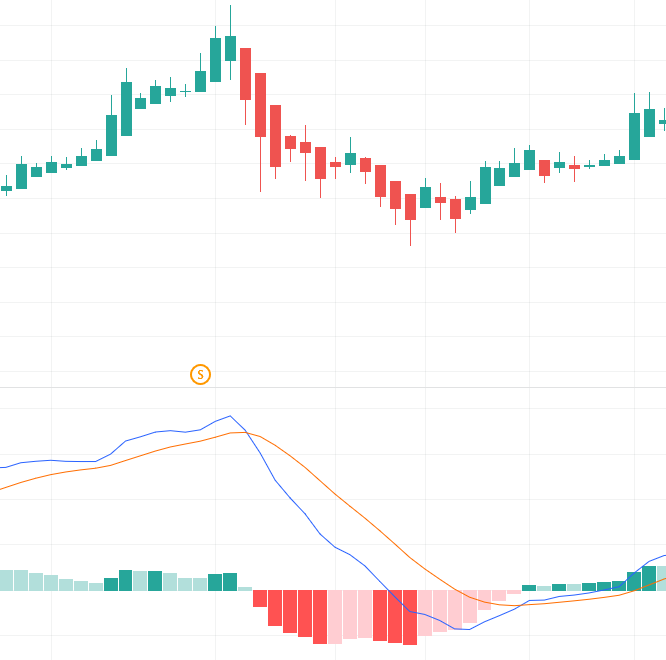
In this example, when the MACD line crosses below the Signal line, the price is beginning to fall.
Warning
Although, just because it is a very popular indicator, and can potentially be very powerful, it does not guarantee success and there is always risk involved. So, understand and become comfortable with risk before trading.