
TYPES OF INVESTORS:
Growth Investor
Investors that buy into companies that are growing quicker than the stock market is growing, AKA, thriving.
Also Read – How To Predict Stock Movement: Support and Resistance
Value Investor
Value Investors buy into companies when the stock price of said company is lower than what they think the value of that company is (Often called Margin Of Safety). Value can often be calculated using RSI or P/E Ratio, and there are two different types of P/E Ratios: trailing and forward P/E Ratio.
Trailing P/E
- Stock Price/PAST Earnings Per Share
Forward P/E:
- Stock Price/EXPECTED Earnings Per Share
Learn better through video? Click here for the course list!
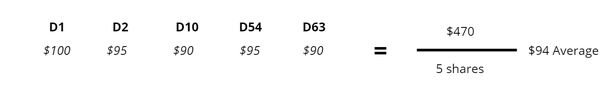
Dollar-Cost Averaging Investor
Investors who divide their investments into equal amounts over the course of time, AKA, buying the same stock at the same price multiple times and ONLY AT THAT PRICE.
Momentum Investor
Investors that buy a stock that is already moving in a direction, hoping that it will continue in that same direction, or better. AKA “hopping on the train” Slogan “buy high, sell higher.”
Investors often take these four strategies and try to find stocks with good statistics and fundamentals that they think may grow in the future.
Where to Find Candlestick Charts
Most charting platforms have some type of candlestick feature, but here are some popular charting platforms:
TradingView
TradingView is one of the most popular online, free, and compact charting platforms. To view a stock with a candlestick chart, enter the stock’s name or ticker in the search bar and press enter. Then, press the button in the top left, next to the “Indicators” button that looks like this:

Then, press on “Candles”. Some may prefer to use the Heikin Ashi candles, as they may seem simpler.
Yahoo Finance
Another popular online charting software, powered by Yahoo. To access the candlestick chart, search up a ticker in the top search bar of the homepage, double click on the area chart, press the button that looks like this:

And choose “Candle”.
Stock Charts
Stock Charts may be a bit confusing for beginners, but it is very compact with features. To access a candlestick chart, search up a ticker in the search bar, and wallah, a candlestick chart has appeared. You can change the settings as you wish.