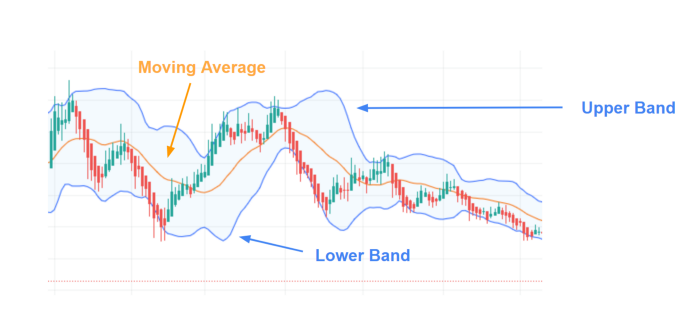
Bollinger Bands
This powerful indicator may be used by traders to identify overbought or oversold signals, and can also be used to measure the volatility of the stock. It is used usually by technical analysts, those who practice technical analysis. Obviously, “Easy” in the title does not mean that trades will always work out 100% of the time. This indicator is not foolproof and it is very likely for you to sustain a loss.
The indicator consists of three lines, the lower band, the moving average in the middle, and the upper band. The moving average is usually a 20-day moving average and the bands are usually two standard deviations from the 20-day moving average. Standard Deviation predicts that 95% of the stock’s historical prices are contained within the range of the two Bands.
Also Read – How to Use the Most Powerful Stock Market Indicator (MACD)
How to Use Bollinger Bands
The moving average in the middle acts as the mean of the prices, and as price gaps up to the upper and lower Bollinger Bands, there is a suggestion of value. So, if price moves up and touches or moves past the upper Bollinger Band, the stock is likely to be overbought and reverse. If the price moves down and touches or moves past the bottom Bollinger Band, the stock is likely to be oversold and reverse.
Bollinger Bands can also give a sense of volatility of the stock or market. As Bollinger Bands get closer together, there tends to be less volatility and as they get further apart, there tends to be more volatility.
What Is Volatility?
Volatility is how much a stock’s price moves about its mean price. In simple terms, volatility is how much a stock’s price changes in a certain period of time.
These strategies aren’t foolproof but they can be used to identify possible trading opportunities and price reversals. So, before using this indicator, understand and be comfortable with the risk.
