
Technical analysis is the method of applying chart analysis and examining movements in price. Technical analysts, those who focus and study on technical analysis, use price movement, volume, and market psychology to try and predict trends.
Quick Notes:
- Technical analysis is the method of identifying certain price points and opportunities based on a chart.
- Technical analysts are those who focus and study on technical analysis and use price movement, volume, and market psychology to try and predict trends.
- Technical analysts use concepts like chart patterns, support and resistance, indicators, and market psychology to predict price movement.
- Traders may study technical analysis as a way to identify breakouts.
How Does Technical Analysis Work?
Technical analysts use concepts like chart patterns, support and resistance, indicators, and market psychology to predict price movement. Charles Dow, dubbed the “father” of technical analysis, was a technical analyst. They often look at charts that allow for candlesticks. Candlesticks are used in technical analysis to identify trends and patterns in a company’s stock in more detail than just a regular line chart. They represent the emotions of traders and a more detailed look at a stock’s price. With dozens, even hundreds, of tools at an analyst’s disposal, he/she has a wide range of strategies to choose from.
Also Read – How to Use Candlesticks and Why You Should
As opposed to fundamental analysis which uses techniques like analyzing a P/E Ratio, technical analysis can also be described as the method of identifying certain price points and opportunities based on a chart. It is usually used to solidify or boost a trader’s confidence in their position.
There are many chart patterns that traders use to try and predict future stock movement. Some of these patterns are called the Double Bottom/Top, Broadening Bottom/Top, the Cup and Handle Pattern, the Three Falling Peaks Pattern, Bollinger Bands, and many, many more.
What Is Support and Resistance?
Support and resistance levels act as barriers to stock movement which can form chart patterns. So, if a stock is bullish, and there is a resistance point, it may be paused and reverse or temporarily be paused. Conversely, if the stock is bearish, and there is a point of support, it may be paused temporarily or reverse.

The line on the bottom acts as a point of support for the chart (almost like a floor), which stops the stock and bounces it the other way when it touches it. The same thing happens at the top line called a resistance line (almost like a ceiling), which stops the stock at the top.
Stock movement is constantly trying to be predicted by investors, traders, and software. There are several ways to do this, and support and resistance is one of them. Support and resistance is sometimes called the foundation of technical analysis.
What Are Indicators?
Indicators are certain tools/overlays that a trader may use to try and predict trends and price movement. They can give alerts, and indicate potential reversals and price movement.
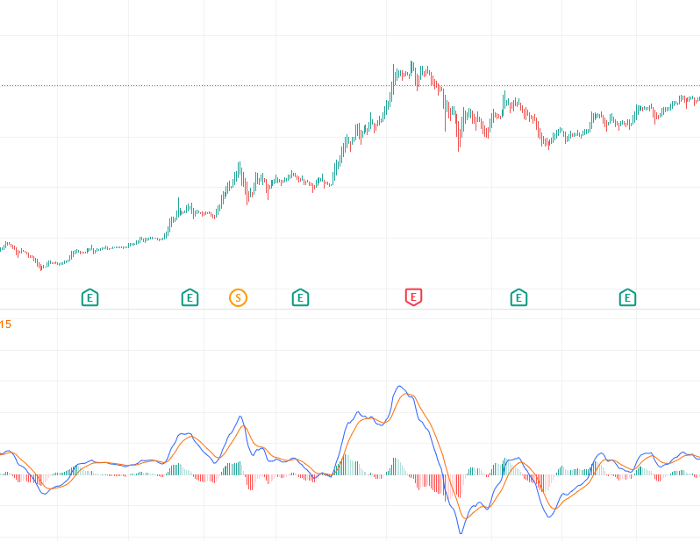
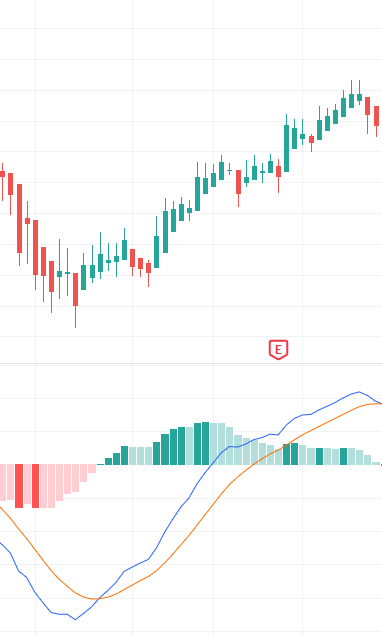
The Moving Average Convergence Divergence (MACD) indicator is one of the most popular indicators in the trading community, as it can recognize price reversals and other movements. Traders may try and predict or wait for the MACD (blue), and the signal line (orange), to cross and enter a trade that way. A strategy is if the MACD line crosses above the signal line, it may indicate an uptrend, and if the MACD line crosses below the Signal Line, it may indicate a downtrend.
Whole Numbers
There is sometimes a tendency for stock price to temporarily stop at whole numbers like 100 and 1,000. This is because of multiple reasons like buyers and sellers setting trading prices at these round numbers, or unsophisticated traders trading at whole numbers rather than those more ambiguous.
Breakouts

Traders may study technical analysis as a way to identify breakouts. Looking at points of support and resistance often analyze the potential for a breakout. A bullish breakout can be identified when the chart passes a point of resistance and a bearish breakout can be identified when the price passes a point of support. You can read more on breakouts here.
The Buyers and Sellers of Technical Analysis
You may have noticed that when a stock moves up and down it doesn’t go in a straight line. Instead, it goes up a little, then down a little, then up a little, then down a little, but still increases or decreases in one direction. This fluctuation is buyers taking control of the stock, as seen with the green candlesticks, and sellers taking control with the red candlesticks. As you can see, this stock bounces up and down until the end when a breakout happens. This fluctuation between prices may create trends.
More Examples of Technical Analysis
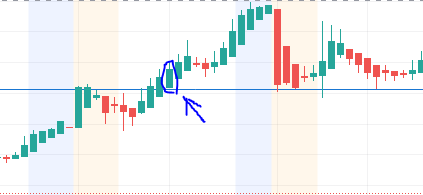
This chart shows the full candle body (circled in blue), closing above the resistance (blue), line. After that, a breakout occurs.
A trader may play this in a few ways. A trader may buy at the bottom support line, then hold it to the resistance line and hope for a breakout. If the breakout occurs, the trader may play the breakout. If a breakout doesn’t occur, the trader may still sell at the resistance price point, or hold it and maybe even buy some more if the stock lowers in price and possibly if it hits the support line.
A trader may do the opposite if shorting. If a trader shorts at the resistance line, he/she may short it until the support line and hope for a breakout down. If it breakout down, AKA a bullish breakout, he/she may play the breakout. If not, the trader may cover their position there, wait until it increases in price, and short some more.
In this case, the MACD line is blue and the Signal line is orange. We can see that when price becomes bullish and starts to create an uptrend, the blue MACD line crosses above the orange Signal line.
What Is the Strat Method?
The STRAT method is possibly one of the most interesting stock market strategies there is. The STRAT method, developed by Rob Smith, is a price action-based charting strategy that analyzes individual candles and how they relate to each other, how they conform to levels of support and resistance, and how they can be traded with other time frames.
This method aims to remove emotion as much as possible by being objective, which means eliminating market noise and using facts to trade. #TheSTRAT, as it is often referred to, uses universal principles in price action.
There are three types of candlesticks in the STRAT method which work as a basis for the whole strategy. It is a very definitive and powerful strategy.
Learn More about the STRAT method
Where To View Charts:
Most charting platforms have some type of candlestick feature, but here are some popular charting platforms:
TradingView
TradingView is one of the most popular online, free, and compact charting platforms. To view a stock with a candlestick chart, enter the stock’s name or ticker in the search bar and press enter. Then, press the button in the top left, next to the “Indicators” button that looks like this:

Then, press on “Candles”. Some may prefer to use the Heikin Ashi candles discussed above, as they may seem simpler.
Yahoo Finance
Another popular online charting software, powered by Yahoo. To access the candlestick chart, search up a ticker in the top search bar of the homepage, double click on the area chart, press the button that looks like this:

And choose “Candle”.
Stock Charts
Stock Charts may be a bit confusing for beginners, but it is very compact with features. To access a candlestick chart, search up a ticker in the search bar, and wallah, a candlestick chart has appeared. You can change the settings as you wish.