
The STRAT method is possibly one of the most interesting stock market strategies there is. The STRAT method, developed by Rob Smith, is a price action-based charting strategy that analyzes individual candles and how they relate to each other, how they conform to levels of support and resistance, and how they can be traded with other time frames.
This method aims to remove emotion as much as possible by being objective, which means eliminating market noise and using facts to trade. #TheSTRAT, as it is often referred to, uses universal principles in price action.
Types of Bars
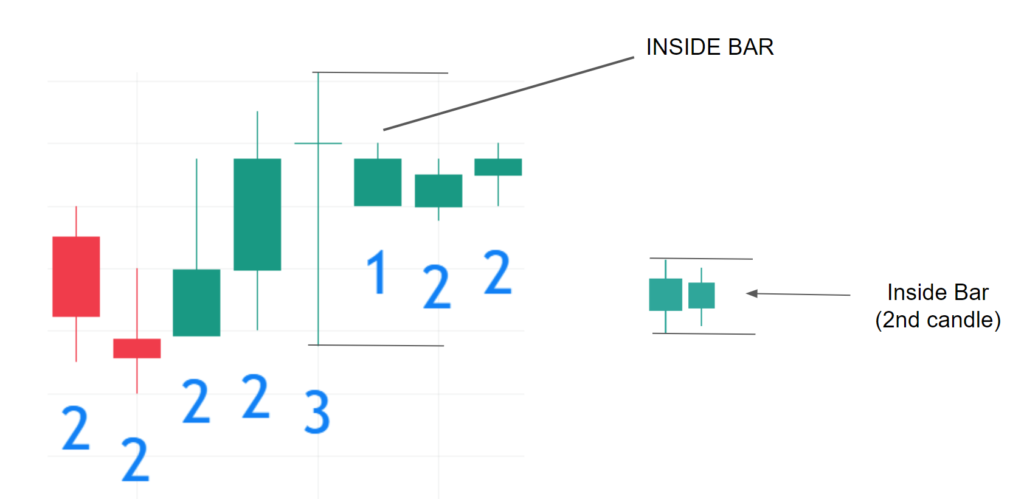
1 candlesticks are bars that are within the range of the previous bar. In this image, the high and the low of this 1 bar is fully within the range of the candlestick before that.
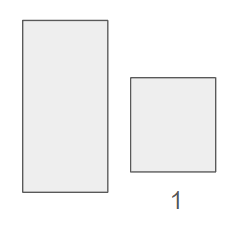
1 bars are often called inside bars, as they form fully within the range of the previous candle. They represent consolidation of price.
To picture this, draw support and resistance lines connecting both bar’s high and both bar’s lows.
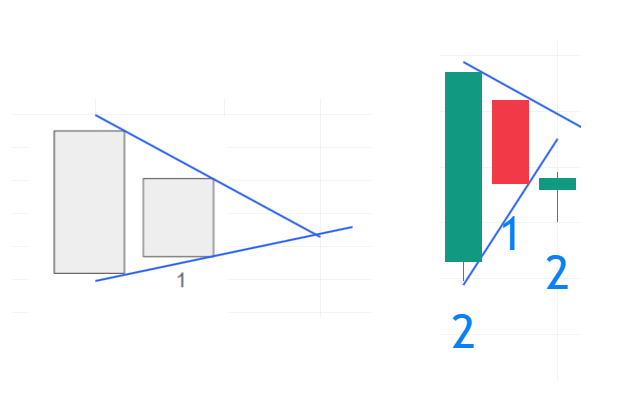
As you can see, by drawing this support and resistance lines there is consolidation. The chart to the right actually has a candle that has broken below the support line.
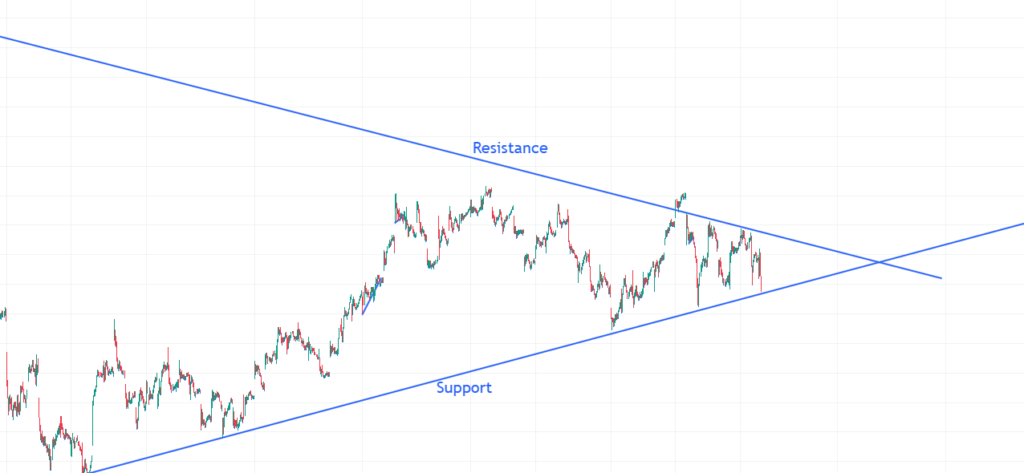
On a bigger chart, consolidation would look something like this:
2 candlesticks are bars that either take out the high or the low of the previous candlestick.
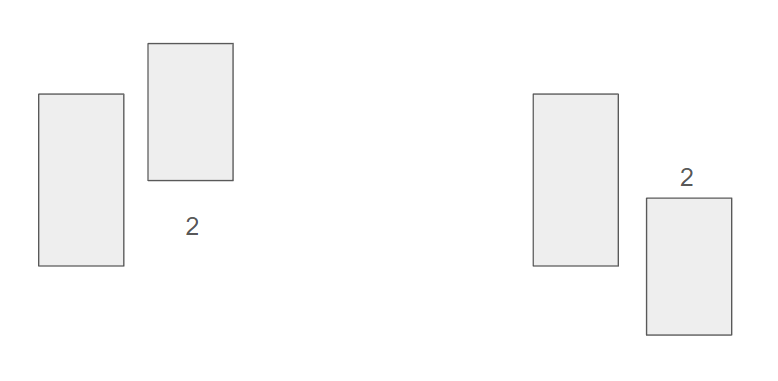
Because they take out the high or the low of the previous candle, they are often referred to as directional bars.
3 candlesticks are bars that take out both the high and the low of the previous candlestick.
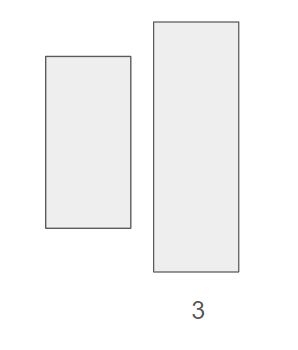
3 bars are called outside bars, as they take out the whole range of the previous candlestick.
Universal Truths of STRAT Trading
There are three universal truths outlined in the STRAT method. They are inside bars, time frame continuity, and broadening formations.
Actionable signals are also a large part of the STRAT method.
Actionable Signals
Actionable signals are candlesticks, patterns, or really anything in the chart from which to take action. Some signals are specific to the method, which is what STRAT traders take action on.
Hammers
Hammers are fairly common to see on a stock’s chart. They are called a hammer because they are in the shape of a hammer. The Hammer candlestick is sometimes used by traders as a signal for a reversal in the stock’s chart.
This is what a hammer candlestick looks like.
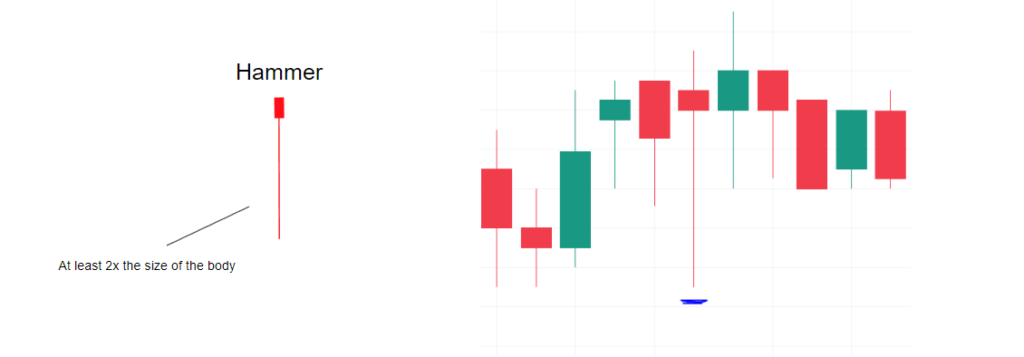
The hammer candlestick is a hammer when the bottom wick part is at least 2x the size of the body which is on the top of the candle. It can be 4 times, it can be 10 times, it just has to be at least 2 times.
This candle shows the psychology of the market which is rejecting lower prices.
Shooters
Like hammers, shooters are also fairly common in the stock market. They are also often referred to as shooting stars.
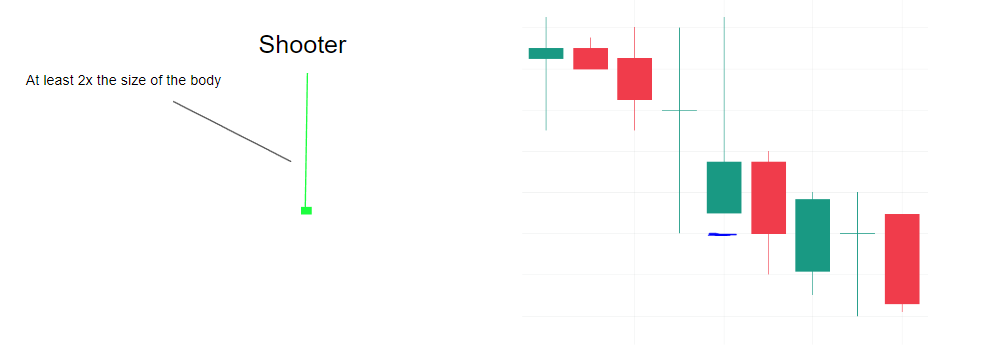
The wick should be at least 2x the length of the body that is on the bottom of the candle, and there is usually no wick on the bottom of the candle. A super small wick is fine to some traders, as long as it is small, but usually, there is no wick.
This candlestick represents a rejection of higher prices.
Inside Bars
As said above, an inside bar occurs when the candlestick, or the bar, is fully within the range of the previous candlestick.
This is labeled with a 1 in the STRAT method and represents consolidation.
Also Read – How to Trade the Pipe Tops and Bottoms Chart Pattern
STRAT Continuations
Continuations are when price moves in one direction. There is also usually consolidation in the trend, but the overall direction of price is one direction.
The patterns of the STRAT method are often called combos. These combos represent possible patterns and trading opportunities.
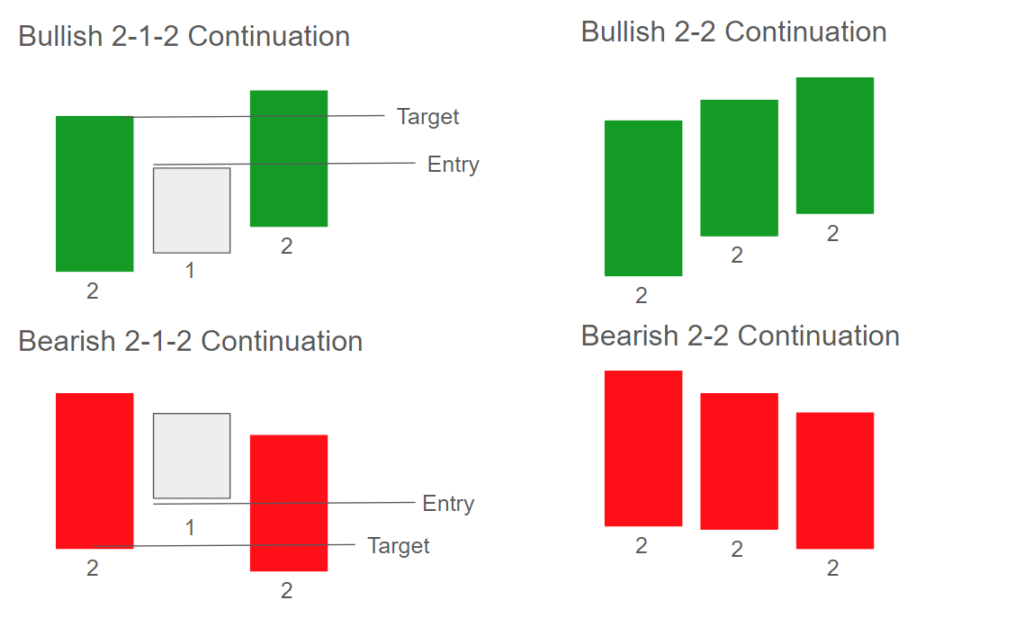
These are four continuation combos that this article focuses on, shown in the image above: The Bullish 2-1-2 Continuation, the Bearish 2-1-2 Continuation, the Bullish 2-2 Continuation, and the Bearish 2-2 Continuation.
Bullish 2-1-2 Continuation
The Bullish 2-1-2 Continuation may be found on an already established uptrend. The first candle of the combo is a 2 candle, then a 1 inside candle.
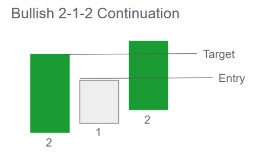
This 1 inside candle represents consolidation. You may hear traders say that continuations are when price moves in one direction, forms consolidation, and then continues the movement in that same, one direction. This is most likely what they’re talking about.
The third, live, candle is a 2 candle, as it is seen moving above the high of the inside bar, 1 candle. This candle is “live” because it is the one that is actively being traded.
For example, when viewing this combo, the trader would first see the first two candles, and think of all of the possible combos that could happen.
A trader’s entry would be one cent above the top of the 1 candle, and the first target price would be the top of the first, 2 candle. The entry is 1 cent above the top of the 1 candle because it acts as sort of a confirmation of another 2 candle forming.
A 2 candle is by definition a candle that takes out a high or a low of the previous candle. If an order that is 1 cent above the 1 candle is triggered, that means that it is at least going to be a 2 or a 3 candle.
Bearish 2-1-2 Continuation
It’s just like the previous combo except it is a continuation of a downtrend.
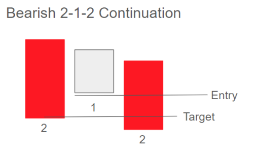
So, there is the 2 candle, then an inside 1 bar, and then the live candle is a 2 that takes out the low of the inside bar. An entry may be 1 cent below the inside bar, and the first target may be the low of the first candlestick of the combo.
These continuations may be used to trade to further price targets.
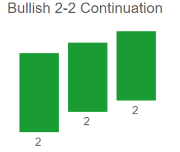
Bullish 2-2 Continuation
This combo is pretty simple as the chart just keeps forming 2 bars, each taking out the high of the previous bar. This may be seen in conjunction with the Bullish 2-1-2 Continuation.
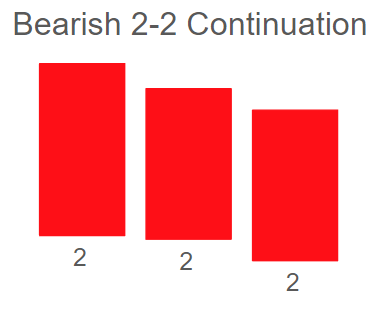
Bearish 2-2 Continuation
The Bearish 2-2 Continuation is basically the opposite of the Bullish 2-2 Continuation, as the chart just keeps forming 2 bars, each taking out the low of the previous bar. This may be seen in conjunction with the Bearish 2-1-2 Continuation.
These are four continuation combos of the STRAT method.
STRAT Reversals
Reversals are STRAT combos that signal a possible reversal of the trend. There are many reversal combos, some of which are easier to scan for than others because they are more distinct.
2-2 Reversal
The 2-2 Reversal has two combos that this article is going to cover: the Bullish 2-2 Reversal and the Bearish 2-2 Reversal.
The Bullish 2-2 Reversal is when there is a 2-down candle, which is the red candle in this diagram, and then there is a 2-up candle, which signals a reversal of the trend.
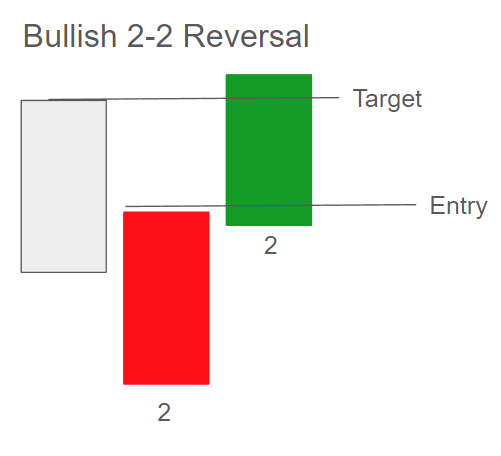
2-up and 2-down just refer to the direction of the candle. So, if the bar took out the previous candle’s low, it may be referred to as a 2-down and if the bar took out the previous candle’s high, it may be referred to as a 2-up.
With the Bullish 2-2 Reversal, an entry may be placed 1 cent above the high of the 2-down bar, and then the first target may be placed at the high of the previous bar. Also, the color of the 2-down bar isn’t usually a specific pattern identifier, meaning that a bullish color would only add confidence to the success of a reversal.
The Bearish 2-2 Reversal is basically the opposite of the Bullish 2-2 Reversal, where the combo has a 2-up bar, then a 2-down bar.
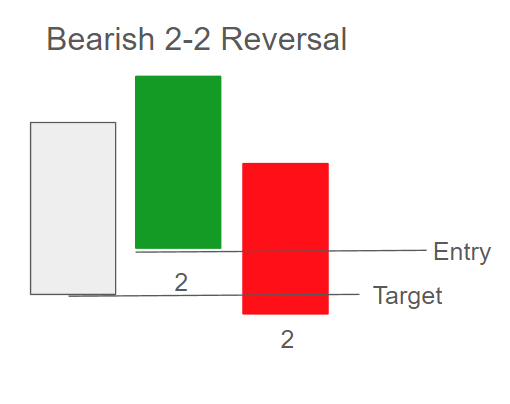
An entry may be placed at 1 cent below the bottom of the 2-up bar, and the first target may be at the bottom of the previous bar. This would be a shorting opportunity.
2-1-2 Reversal
The 2-1-2 Reversal also has two types, bullish and bearish. They are simple to scan for because there is an inside bar in the combo.
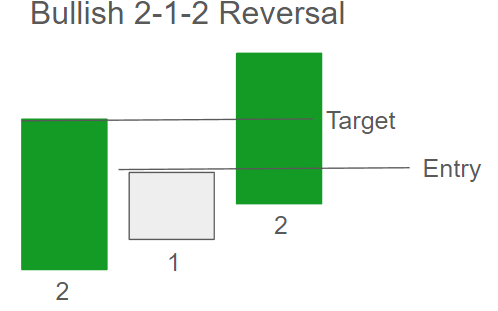
The Bullish 2-1-2 Reversal combo begins with a 2 candlestick. The second candlestick is going to be an inside bar, which is a 1 candlestick.
Then, the live candlestick is a 2-up. The colors really just add confidence to the success of a reversal.
The entry price maybe 1 cent above the high of the inside bar, and the first target price may be the high of the first 2 bar.
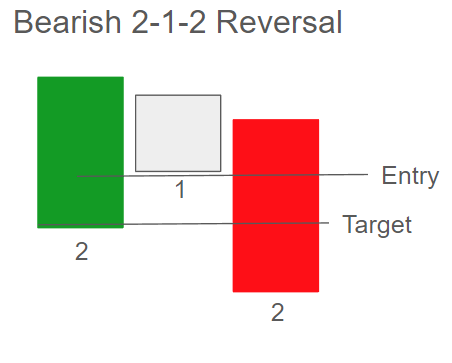
The Bearish 2-1-2 Reversal combo begins with a 2 candlestick. The second candlestick is going to be an inside bar, which is a 1 candlestick.
Then, the live candlestick is a 2-down. The entry price maybe 1 cent below the low of the inside bar and the first target price may be the low of the first 2 bar.
3-1-2 Reversal
The 3-1-2 Reversal is like the 2-1-2, except the first candle is a 3. There are two types again, bullish and bearish.
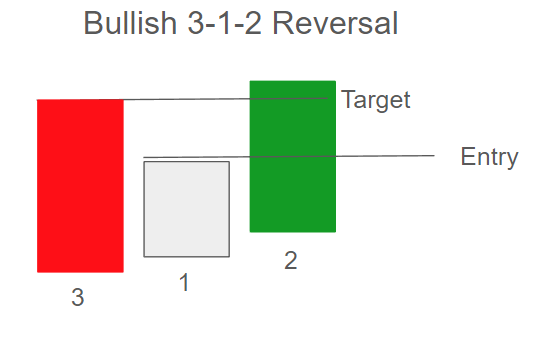
The Bullish 3-1-2 Reversal starts with a 3 bar which is likely red, then a 1 inside bar forms and the live bar is a 2-up. The entry price maybe placed 1 cent above the inside bar, and the first target price may be placed at the top of the 3 bar.
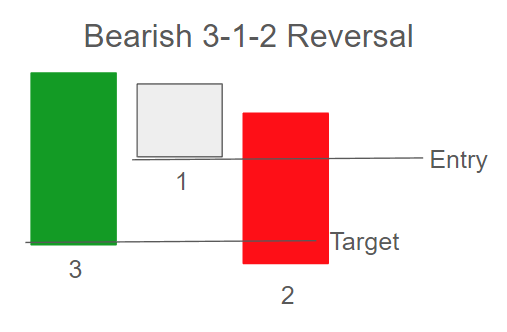
The Bearish 3-1-2 Reversal starts with a 3 bar which is likely green, then a 1 inside bar forms and the live bar is a 2-down. The entry maybe placed 1 cent below the inside bar, and the first target price may be placed at the bottom of the 3 bar.
3-2-2 Reversal
The 3-2-2 Reversal is like a 2-2 reversal except the first candle is a 3. There are two types, bullish and bearish.
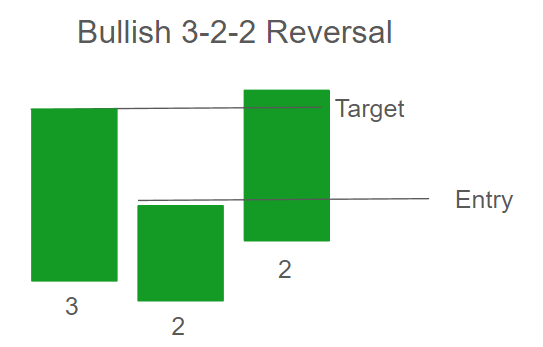
The Bullish 3-2-2 Reversal begins with a 3 bar, and then a 2-down is formed. The live bar is another 2 which is a 2-up. The entry price may be at 1 cent above the 2-down, and the first target price may be the top of the 3 bar.
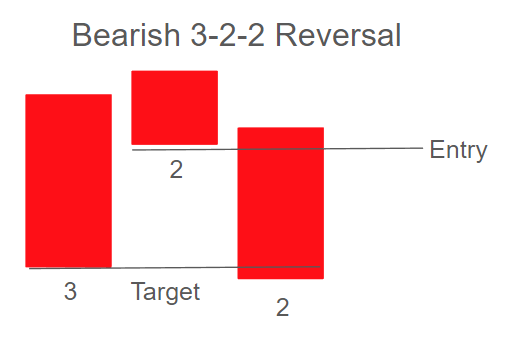
The Bearish 3-2-2 Reversal begins with a 3 bar, then a 2-up. The live bar is another 2 which is a 2-down. The entry price may be at 1 cent below the 2-up, and the target price may be placed at the bottom of the 3 bar.
1-2-2 Rev Strat
The Rev Strat that this article is going to cover is the 1-2-2 Rev Strat. Don’t get caught up with the fancy Rev Strat name either, it’s really just a description.
There are two types, bullish and bearish.
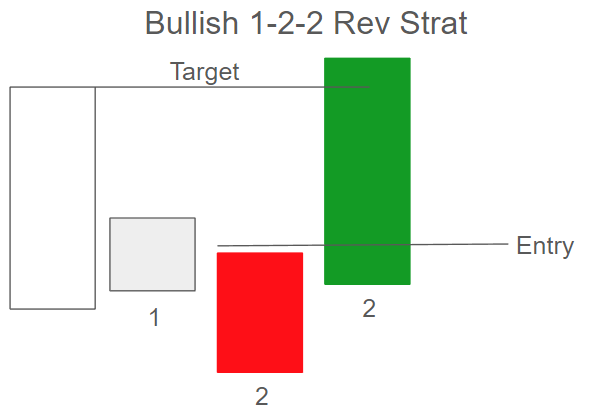
The Bullish 1-2-2 Rev Strat starts with a 1 bar which means that there is a previous candle that it is within the range of. It could be a 2, for example.
There is a have the 1 bar, then a 2-down bar. The next candle is the live candle which would be a 2-up.
An entry may be placed 1 cent above the 2-down candle, and a target may be at the high of the candle before the 1 bar.
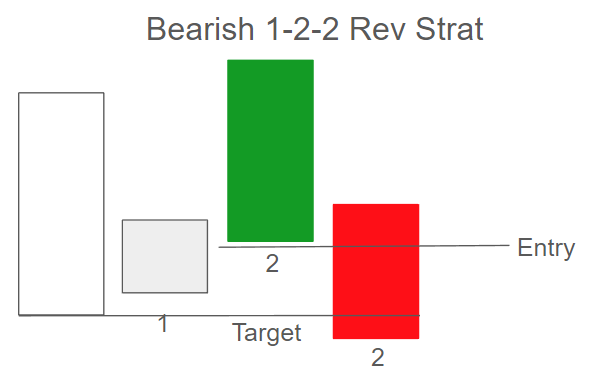
The Bearish 1-2-2 Rev Strat begins with a 1 bar, which again, means that there is a previous candle that it is within the range of. Then the next candle is a 2-up.
After that, the live candle would be a 2-down.
The entry price may be placed 1 cent below the 2-up. The first target price may be at the bottom of the 1 candle and the second target price may be at the bottom of the candle before the 1 bar.
Or, the first target price may be placed at the bottom of the candle before the 1 bar.
Time Frame Continuity (FTFC) and the STRAT Method
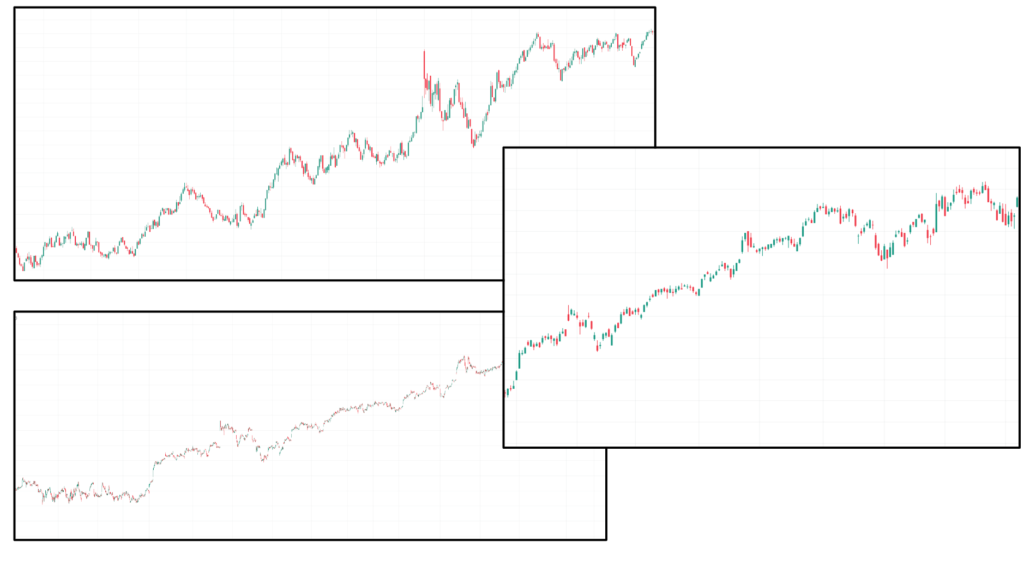
FTFC stands for Full Time Frame Continuity. When looking at the time frames of a chart, it basically means that the more time frames that are moving in the same direction that you are trading in, the higher chance of the trade working out.
That does not mean that when you see FTFC your trade will always work out, but the general idea is one of confidence in trades, and possibly a higher or lower chance of trade success.
In these charts, there is Full Time Frame Continuity, as all of the charts have an uptrend.
Let’s look at this chart:
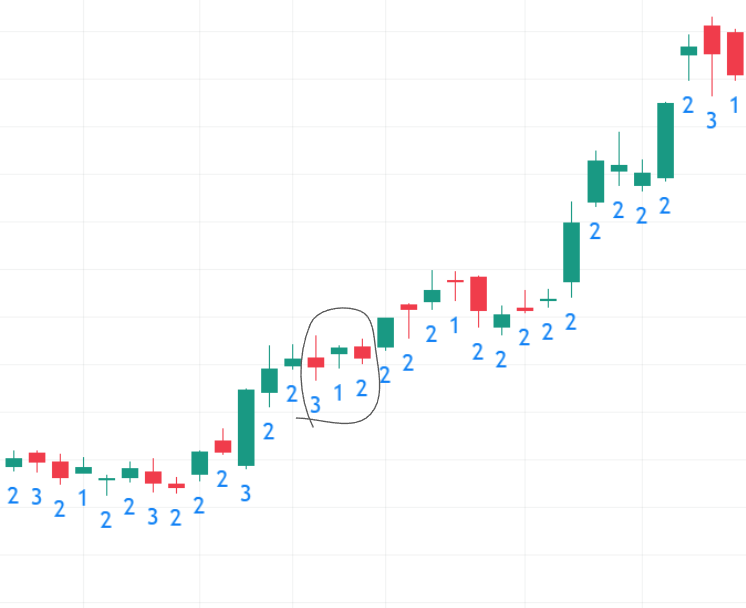
We see a Bearish 3-1-2 Reversal circled, but it didn’t hit the high of the 3 bar which would be a potential target price, and the trend has continued upwards.
Why is this?
Well, one reason could be because the traders were trading against the uptrend. Other time frames may have been in an uptrend too. This is where FTFC comes into play.
Traders should look at price in smaller time frames and compare its patterns and direction to price in longer time frames to try and determine candle direction.
This strategy doesn’t always work but many traders put it into practice without knowing it is a strategy.
Different Trader Types
When determining time frame continuity, Rob Smith favors different time frames according to the type of trader.
Generally, the preferred time frames are the month, week, day, and hour, except traders may choose to evaluate different time frames according to their goals.
Long Term Investors
For long term investors, because their goal is holding for much longer lapses of time than many other traders, the preferred time frames are the yearly, quarterly, monthly, and weekly.
Swing Traders
For swing traders, the preferred time frames are the monthly, weekly, daily, and the hourly. Swing traders are traders whos general time frame is from more than a day to a few months.
Day Traders
For day traders, the preferred time frames are the daily, half a daily, hourly, and 15 minutes. Day traders trade within a day, often having positions open for a few seconds or a few minutes.
Broadening Formations and the STRAT Method
Broadening formations are a key part of STRAT trading. It is, of course, a universal principal of the STRAT method.
According to Benzinga Pro, “broadening formations are important when trying to identify larger outside bars with higher highs and lower lows,” (Jurcak). Rob Smith has a thesis that securities trade in series of higher highs and lower lows.
A broadening formation is when price is making higher highs and lower lows. A drawing of a broadening formation may look like this:
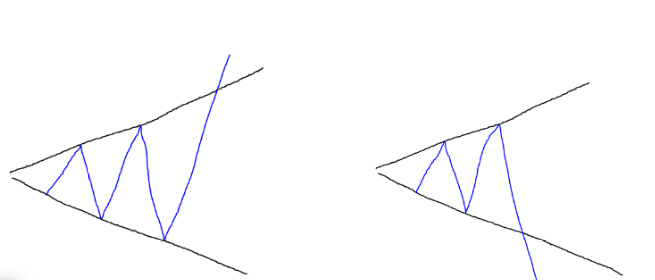
The diagram on the left is a drawing of a broadening bottom, and the diagram on the right is a drawing of a broadening top.
A broadening bottom is bullish on the breakout and a broadening top is bearish on the breakout. This pattern is used by technical analysts, those who study technical analysis.
The 3-Bar
A broadening formation may also be identified by a 3 bar. Because the 3 bar takes out both the high and the low of the previous candle, it naturally expands price, or broadens price.
Broadening patterns often create distinct lines of support and resistance so they can be used to identify points of reversal in the trend.
If price is hitting a level of support, the trader may look for a bullish reversal combo, and if price is hitting a level of resistance, the trader may look for a bearish reversal combo.
Other parts of the STRAT method and all trading should also be considered, like time frame continuity.
Learn more about the Broadening Pattern here.
Stop Losses and the STRAT Method
A stop loss is a certain action that can be performed at a certain price to limit loss. Stop losses are often used by traders, not only with the STRAT method but with all types of trading and investing.
In this chart, we see a Bullish 2-2 Reversal. The green line is our entry point which is at the high of the 2 down bar in the combo.
With the three blue lines as our target prices set at the highs of previous candles, we have set a stop loss at the bottom of the middle 2 bar (the 2 down bar), of the reversal combo. If price comes down to hit this stop loss level, a sell order will be placed.
In this chart, we see that price moved up and hit our first target. Then it hit our second target.
At this point when price hit our second target and the second 2-up is forming after the combo, we may move our stop loss up to our entry point, so that if price comes back down we will break even.
If price hits our third target level and the third 2-up is forming after the combo, we may move our stop loss to above our entry point but below our target and the current price, so that if price comes back down we will stay in profit.
Learn More About the Stop-Loss
Please note that this is only an example and not a real trade. These combos, patterns, and candlesticks are not perfect and may result in a loss of capital. There is always a risk to lose capital while trading so trade at your own risk.
Pivot Machine Gun STRAT Strategy
The Pivot Machine Gun (PMG), is a STRAT method strategy that is not very well known in the technical analysis world but also employs the chance of price rapidly increasing or decreasing in a short amount of time to profit.
It works just like the other STRAT combos and it employs time frame continuity.
How to Trade the Pivot Machine Gun
What traders look for are points in the chart where price makes higher lows or lower highs, consecutively. Generally, 5 or more higher lows or lower highs.
Whether traders look for consecutive higher lows or consecutive lower lows depends on the direction the trader wants to trade.
If the trader is intending to buy, then he or she would look for consecutive lower lows, as the Pivot Machine Gun would be a reversal of that trend. If the trader is intending to short, then he or she would look for consecutive higher lows.
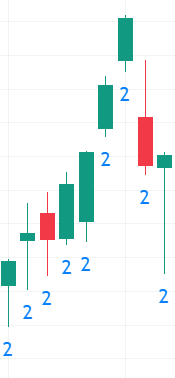
In this example, the chart made consecutive higher lows, with an uptrend of 2 bars. At the top, a Bearish 2-2 Reversal combo can be seen and in 2 days, price takes out four price targets. Let’s look at this example again, but marked up.
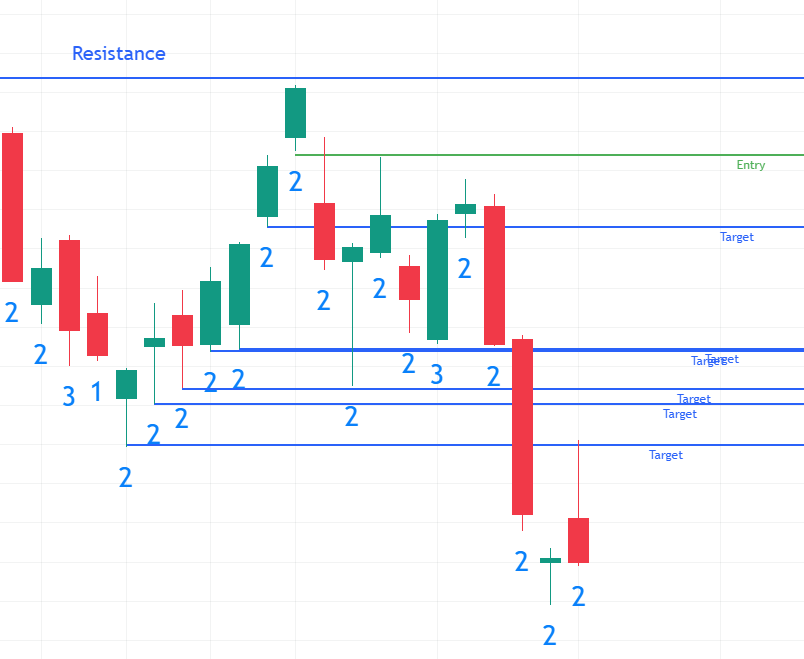
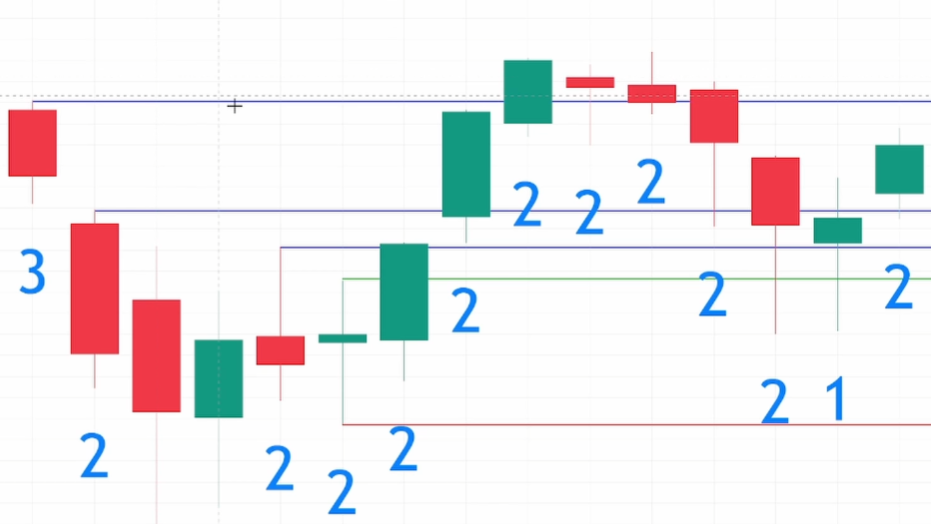
In this chart, which is the same as the previous PMG example, but more price action is shown, an entry price, a resistance line, and target prices are labeled.
The entry price should be 1 cent below the low of the top candle, as traders want to make sure that a 1 candle is not forming.
Traders usually place their target prices at the levels of support, the lows of the previous bars.
We can see that price rapidly broke through the previous price targets on the first 2 days of the reversal, then consolidated a little, then continued downwards to break more target levels and even continued further.
After the first two days of this chart, traders may have moved their stop-loss to the entry price to break even if price came back up to hit it.
Learn More About the Pivot Machine Gun
Further Notes
As a further note, the Bullish 2-2 Reversal on the bottom of the chart failed to reach the target price of the large red candle, but instead hit the target price of the 2 candle that formed a point of resistance.
The reason for this may be because of the direction of the trend, time frame continuity, and/or because of the line of resistance formed by that 2 bar.