
The Three Falling Peaks pattern is a particularly interesting pattern. It is studied by professional traders like Thomas Bulkowski. The pattern is a breakout pattern where the breakout is bearish.
The pattern begins with an uptrend, which is followed by three peaks in price and then returns to the downside after the breakout. It also includes the concept of support and resistance.
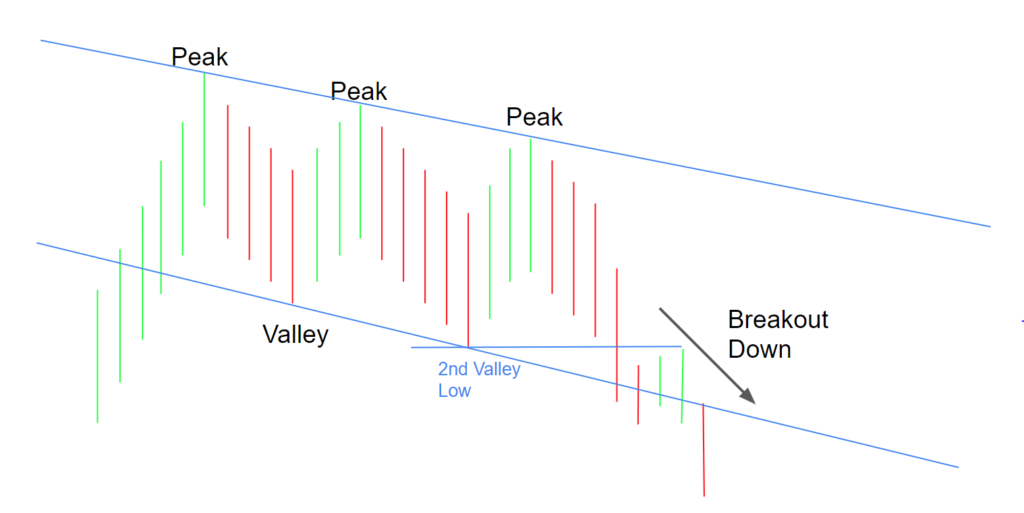
The Three Falling Peaks Pattern
As said before, the Three Falling Peaks pattern is preceded by an uptrend which leads into the first peak. The first peak is followed by two more peaks, each one lower than the next. These peaks often bounce off of a line of resistance, which can aid scalpers.
Each peak should look similar to each other peak, according to ThePatternSite.com. This symmetry in price encourages a correct pattern label.
The bottom between the two peaks is sometimes referred to as valleys, as this pattern is similar to the Three Rising Valleys chart pattern.
The valleys create support levels which are often used to trade and predict this pattern, as well as the breakout and further trading opportunities.
The concept of Elliott Waves may also be incorporated into this pattern.
How to Trade the Three Falling Peaks Pattern
Traders may find a trading opportunity at many points in this pattern. A less obvious, yet important opportunity, is created by a support level seen at the second valley low.
In this pattern, if price breaks below this second valley, what is often seen is traders shorting or selling and driving the price down. This can be a major trading opportunity.
Another way is to sell or short at a resistance line created by the peaks, as traders may expect price to bounce off this line.
Entering into a buy position may be done by some traders when the price hits a level of support created by the valleys.
A trader should consider placing a stop loss order to buy back a short position to limit loss. Bulkowski proposes placing a stop loss at the third peak high.
Further Statistics
Jul 12, 2022: The 22nd bear market since 1929 is upon us, which can be an encouragement for those trading this pattern.
Not only does the pattern create a downtrend and result in a bearish breakout, but the decline of this pattern, if measured from the top of the pattern, is on average 10% greater in a bear market as opposed to a bull market, (Bulkowski 685).
According to the Trading Campus, there is usually about a 15% decline in the price level since the start of the pattern.