
Those who day trade often follow a well-planned and established strategy, as well as a ruleset. These strategies come in different forms like scalping, pullback trading, breakout trading, and in this case, the STRAT method.
Claim Your FREE STRAT Combos Cheat Sheet
What Is the STRAT Method?
The STRAT method is possibly one of the most interesting stock market strategies there is. The STRAT method, developed by Rob Smith, is a price action-based charting strategy that analyzes individual candles and how they relate to each other, how they conform to levels of support and resistance, and how they can be traded with other time frames.
This method aims to remove emotion as much as possible by being objective, which means eliminating market noise and using facts to trade.
Learn more about the STRAT Method here.
Day Trading With the STRAT Method
The STRAT method generally works the same way for day trading and all other time frames. Although, the faster the candlestick, the harder it may be to trade profitably.
A day traders should completely understand his or her trading setup and how to enter and exit trades before participating in any activity. He or she should also know how to place levels of support and resistance, stop-loss levels, target levels, and anything else they deem necessary to know.
Day trading is extremely risky and it often requires large amounts of capital to be leveraged in order to make considerable profits.
Also Read – How Much Money Do I Need to Trade Stocks?
Full Time Frame Continuity
Day traders should also understand and utilize the concept of full time frame continuity (FTFC).
When looking at the time frames of a chart, time frame continuity basically means that the more time frames that are moving in the same direction that you are trading in, the higher chance of the trade working out.
Time frame continuity is a part of full time frame continuity. As time frame continuity means time frames moving in the same direction, FTFC means all of the identified time frames moving in the same direction.
The usual time frames that STRAT traders use are the month, week, day and hour, although this may change for day trading. It is up to the trader to understand and choose what time frames to use, and to be solely responsible for their actions.
STRAT Combos
Day traders who are trading with the STRAT method look for candlestick combos to set an entry, stop-loss, and target price(s) on. A common STRAT combo is the 2-2 reversal.
Reversals are STRAT combos that signal a possible reversal of the trend. There are many reversal combos, some of which are easier to scan for than others because they are more distinct.
2-2 Reversal
The 2-2 Reversal has two combos that this article is going to cover: the Bullish 2-2 Reversal and the Bearish 2-2 Reversal.
The Bullish 2-2 Reversal is when there is a 2-down candle, which is the red candle in this diagram, and then there is a 2-up candle, which signals a reversal of the trend.
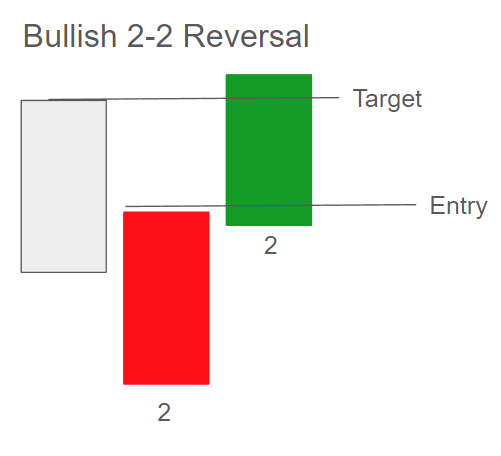
2-up and 2-down just refer to the direction of the candle. So, if the bar took out the previous candle’s low, it may be referred to as a 2-down and if the bar took out the previous candle’s high, it may be referred to as a 2-up.
With the Bullish 2-2 Reversal, an entry may be placed 1 cent above the high of the 2-down bar, and then the first target may be placed at the high of the previous bar. Also, the color of the 2-down bar isn’t usually a specific pattern identifier, meaning that a bullish color would only add confidence to the success of a reversal.
The Bearish 2-2 Reversal is basically the opposite of the Bullish 2-2 Reversal, where the combo has a 2-up bar, then a 2-down bar.
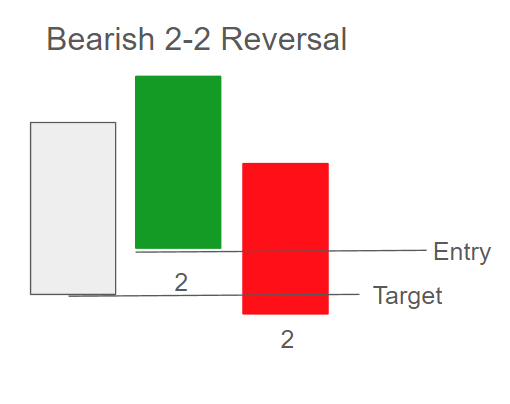
An entry may be placed at 1 cent below the bottom of the 2-up bar, and the first target may be at the bottom of the previous bar. This would be a shorting opportunity.
Creating a Ruleset
Rulesets are generally self-made instructions that traders hold themselves to in an attempt to minimize risk. They are common among all traders, but especially among day traders who employ a specific strategy, like the STRAT method.
A ruleset should be strictly followed and a trader should not break from their ruleset unless necessary.
Rulesets usually include a target price range, buy price, sell price, stop-loss, confirmation instructions, and anything else that a trader would follow routinely.
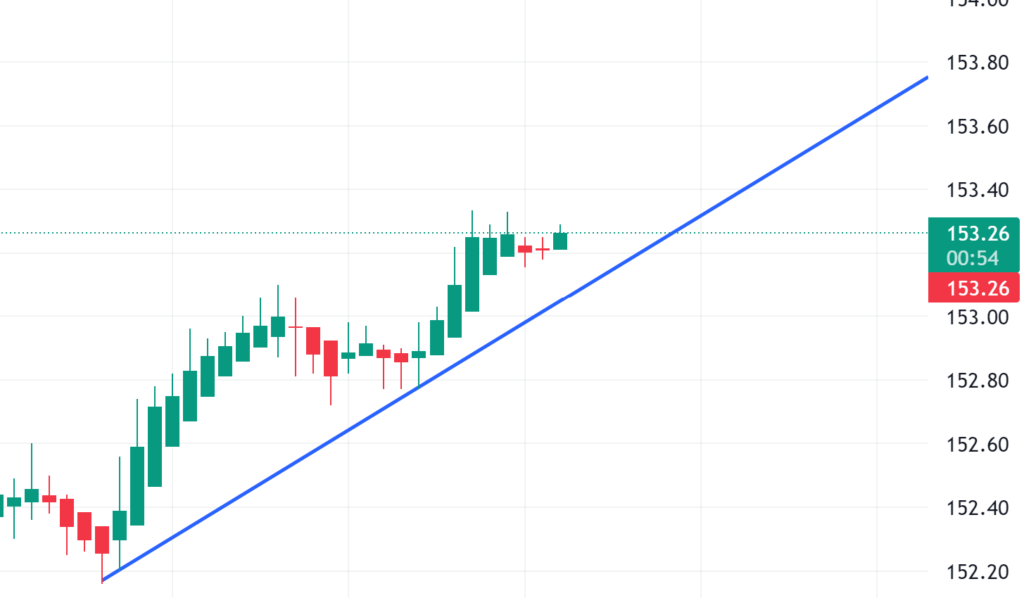
Here’s a sample ruleset for this chart when scalping:
Buy price: When the stock touches the support line (probably around $153.30)
Sell price: 10 cents above buy point (in this case it depends on a trader’s leverage based on their capital)
Confirmation: Bounce off support line and MACD, or other indicators, and a second candle
Stop-Loss: if the stock falls below the support line (find price level)
Time Frame Continuity (FTFC) and Day Trading With the STRAT Method
FTFC stands for Full Time Frame Continuity. When looking at the time frames of a chart, it basically means that the more time frames that are moving in the same direction that you are trading in, the higher chance of the trade working out.
That does not mean that when you see FTFC your trade will always work out, but the general idea is one of confidence in trades, and possibly a higher or lower chance of trade success.
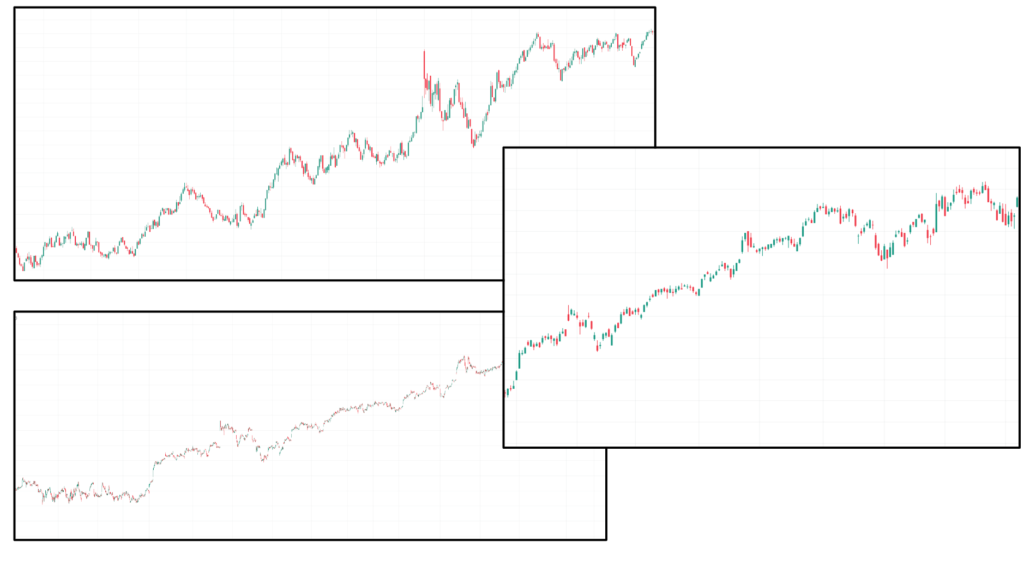
In these charts, there is Full Time Frame Continuity, as all of the charts have an uptrend.
Let’s look at this chart:
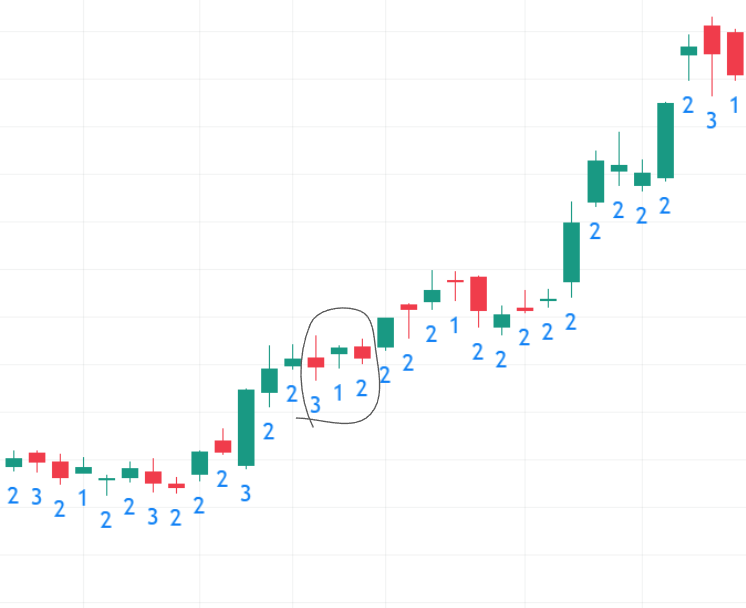
We see a Bearish 3-1-2 Reversal, but it didn’t really work out, and the trend has continued upwards.
Why is this?
Well, one reason could be because the traders were trading against the uptrend. Other time frames may have been in an uptrend too. This is where FTFC comes into play.
Traders should look at price in smaller time frames and compare its patterns and direction to price in longer time frames to try and determine candle direction.
This strategy doesn’t always work but many traders put it into practice without knowing it is a strategy.
Different Trader Types
Day Traders
For day traders, the preferred time frames are the daily, half a daily, hourly, and 15 minutes. Day traders trade within a day, often having positions open for a few seconds or a few minutes.
Learn about the other types here.