
What is scalping and how do professional day traders profit from this strategy? Be sure to read the disclaimer at the bottom before reading this article.
Scalping is a certain trading style where traders specialize in making quick trades off small price changes. It uses the concept of support and resistance heavily and can incorporate indicators and chart patterns.
Scalping is often confused with swing trading.
Scalpers often make multiple trades in a day and are bound by their own set of rules. Having a ruleset and following it is essential to managing risk while day trading.
Creating a Ruleset
Rulesets are generally self-made instructions that traders hold themselves to in an attempt to minimize risk. They are common among all traders, but especially among day traders who employ a specific strategy, like scalping.
A ruleset should be strictly followed and a trader should not break from their ruleset unless necessary.
Rulesets usually include a target price range, buy price, sell price, stop losses, confirmation instructions, and anything else that a trader would follow routinely.
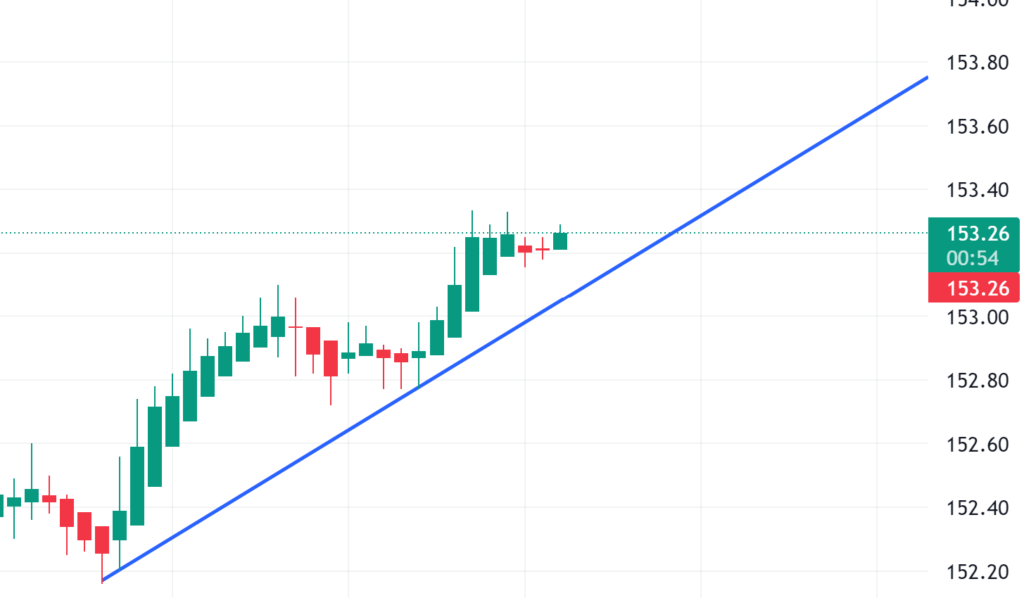
Here’s a sample ruleset for this chart when scalping:
Buy price: When the stock touches the support line (probably around $153.30)
Sell price: 10 cents above buy point (in this case it depends on a trader’s leverage based on their capital)
Confirmation: Bounce off support line and MACD, or other indicators, and a second candle
How Does Scalping Work?
When scalping, traders find a chart, often a candlestick chart, and may identify points of support and resistance and swing highs and lows. So, on the chart above, we see that the stock is expected to hit the line of support again, and if it does, traders may buy at the point of support.
Scalpers who buy at the support line will likely sell quickly, as they usually leverage large amounts of capital and can day trade with a few cents.
Also Read – How Much Money Do I Need to Trade Stocks?
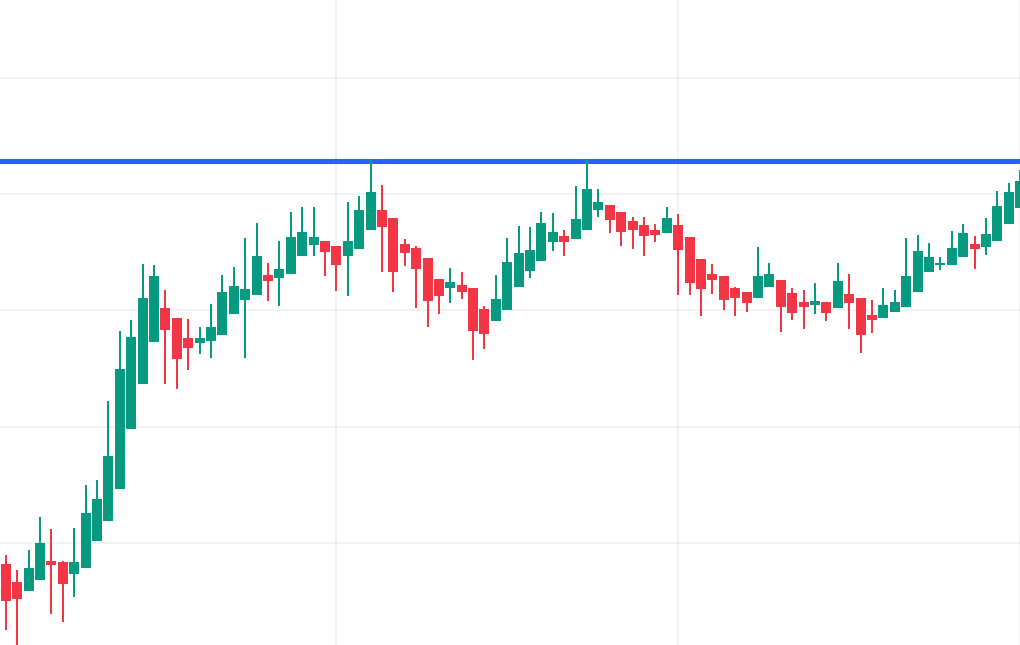
So, now that we understand that the support line is a demand zone and that other traders are doing the same thing, we can understand how traders use scalping to make quick profits.
Traders can also do the same thing, but by shorting. Here, we can see that the stock bounced off the resistance line, providing the opportunity for the trader to short.
Scalping Strategies
There are many strategies that scalpers can utilize to confirm, find trading opportunities, and watch a chart.
MACD Scalping Strategy
It is important to keep in mind that this is a lagging indicator so it may not update as soon as needed, possibly causing unfavorable outcomes.
The Moving Average Convergence Divergence indicator is an indicator that shows a relationship between two moving averages. Many traders choose to compare the 26 exponential moving average with the 12-day EMA. Then, set the signal line to a 9-day EMA.
If the MACD line crosses above or is about to cross above the signal line, it may indicate a bullish trend. This, coupled with the scalping strategy of price hitting a line of support, may indicate a potential buying opportunity.
The opposite is true for shorting: If the MACD line crosses below or is about to cross below the signal line, and price is hitting a level of resistance, it may indicate a potential shorting opportunity.
Learn more about the Moving Average Convergence Divergence (MACD)
Parabolic SAR Scalping Strategy
The Parabolic SAR indicator helps the trader determine the direction in which the security is moving, and helps determine possible reversals in the trend. It usually is shown with circles or stars, below the price in an uptrend, and above the price in a downtrend.
When the indicator moves from below to above, it may indicate a bearish signal in price, and when the indicator moves from above to below the price, it may indicate a bullish signal.
Learn more about the Parabolic SAR
RSI Scalping Strategy
The Relative Strength Index indicator can be utilized as a scalping strategy. Some traders prefer to use the Stochastic RSI, but this will just focus on the RSI.
The strategy is very simple, so it should be combined with other confirmation and factors, but it goes as follows:
If the RSI is high, then the security may be overvalued at the moment, and it may not be a good idea to buy, but may be a good idea to short.
If the RSI is low, then the security may be undervalued, and traders may consider buying. This strategy can be very fragile so be careful with it and understand the risk.
Risks
Scalping and day trading is not only extremely risky but many traders lose capital from it. It is your responsibility to ensure that day trading is right and legal for you. Before day trading, and before any trading, understand and be comfortable with the risk. Ensure that you are legally able to participate in day trading. By reading this article, you take full responsibility for all and any loss of capital or other undesirable consequences to trading. Never take any trade based on what you see in this video. I will not be held responsible for any losses that occur.
Let’s look at why a trader may not enter a trade. There are many reasons why a trader may not enter a trade like news and sentiment, but in this case, we’re going to focus on breakouts and indicators.
If the indicator is not moving in the desired way for the trader, he or she may not enter the trade. For example, if the MACD indicator is super choppy, and it is hard and really risky to see where and when the MACD line will cross, the trader may not enter a trade.
Another reason that traders may not enter a trade is breakouts. During a potential breakout, a trader generally looks for confirmation from the candlestick before trading.
So, let’s say that the breakout may be bullish. If the candlestick closes above, or the body completely passes, or the whole candlestick passes the resistance line, it may indicate enough confirmation for the trader to enter the trade.
The same is true for support lines. If the candlestick closes below or does anything else that warrants confirmation for the trader, then it may indicate a trading opportunity.
Confirmation is dependent on the comfort level of the trader. That means that confirmation is whatever the trader considers confirmation to be. This should be in the ruleset of the trader and the trader should not break from their ruleset.
The last reason is the number of times the support or resistance line has been tested. The more times the support or resistance level has been tested, the weaker it gets, generally meaning the more likely there is for a breakout.
A weak support or resistance level may compromise a trader’s position, and produce unintended outcomes.
It is important to understand all of this, and also to understand that there is risk involved when trading, always.