
A stop-loss is a certain action that can be performed at a certain price to limit loss. It usually takes form as a selling action once an asset reaches a specific price.
It not only helps traders stay disciplined but also ensures that traders follow part of a certain ruleset which may significantly prevent loss. Having a ruleset and following it is essential to managing risk.
How Does a Stop-Loss Work?
A stop-loss is generally utilized when a trader does not want to, or cannot, monitor a stock constantly.
When a trader places a stop-loss order, the trader instructs his/her broker to pre-set a price, so when price reaches that level the security is sold, often automatically.
Here’s an example:
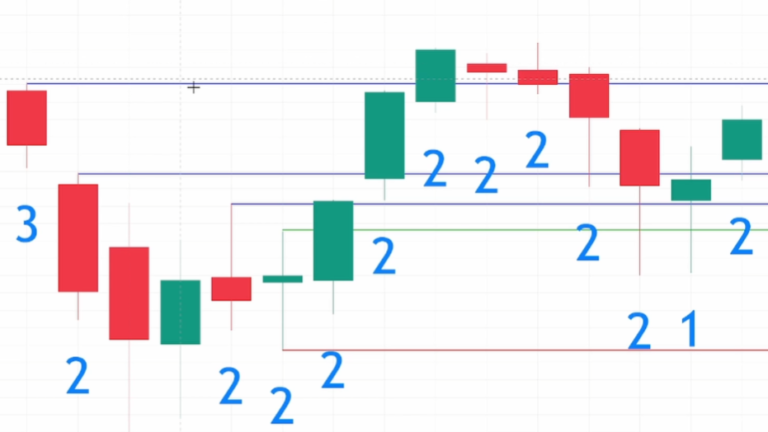
This is an example of a trader using the STRAT method to trade and set a stop-loss. The red line is the stop-loss level.
In this Bullish 2-2 Reversal, an entry price is placed at the green line and there are a few target prices marked with the blue lines.
If price moves in the undesired direction, which is downwards and it hits the stop-loss (the red line), a sell order will be placed.
Different Types of Orders
There are different types of stop-loss orders. The ones covered in this article are the market and the limit.
Market Stop-Loss
A regular stop-loss order is usually a market order. This means that when price activates this stop-loss order, a selling action will commence with a market order.
A market order is a certain specified order which tells the broker to buy or sell a certain asset at the market’s current and best available price. This may be advantageous or disadvantageous in different situations as the current price may not be the price the trader is looking for.
Limit Stop-Loss
Another type of stop-loss is by utilizing a limit order. This means that when a stop-loss limit order is activated, at the stop price the order turns into a limit order which only executes the order at that limit price or better.
The limit price is usually set beforehand by the trader. Again, this may be advantageous or disadvantageous in different situations, as it may offer the trader more control over the sell price.
With a limit stop-loss order, there is no guarantee that the trade order will be executed. This may happen if the stock is highly volatile or rising and falling quickly.
“Stop-limit orders are used in situations where although the price of the stock or other security has fallen below the limit price, the investor does not want to sell at the current low price and is willing to wait for the price to rise back to the limit price,” (Cussen).
Trailing Stop-Loss
A trailing stop-loss is a stop-loss that moves with the price. It can be expressed as a specific value or as a percentage of the stock’s price.
So, if a stock is 50 dollars and the trader wants to sell if the stock drops 15%, then he or she may set a trailing stop-loss. If the trader sets a 5% trailing stop with a current share price of 50 dollars, then the stop-loss level would be 42 dollars and 50 cents.
If the stock price moves up to 100 dollars, then the stop-loss level would be 75 dollars.
Note, that this trailing stop’s only direction is upwards once a new peak has been established and cannot move back downwards after moving upwards.
A Stop-loss is also referred to as a ‘stop order’ or a ‘stop-market order’.
Where Do I Place a Stop-Loss?
Ultimately, the position of a stop-loss is determined by the trader and the trader alone, but technical analysis may be very useful in determining appropriate levels.
Strategies that may be utilized to predict an advantageous spot are support and resistance, the STRAT method, indicators, news, price history, and sentiment.
For example, the image above represents the STRAT method being used to determine price levels along with the stop-loss level. The stop-loss in that chart is placed at the low of the middle, 2 up candle.
This allows for enough room for price to move but also for strategic risk management.
If you want to learn where stop-loss levels may be placed by using the STRAT method, learn more about the STRAT method here.
Average True Range (ATR) Strategy
While the strategy of just using something like support or resistance as a marker of where to place your stop-loss may work, and having a stop-loss usually is better than not having one, many traders may get stopped out prematurely.
To avoid this, traders may use an indicator called the Average True Range (ATR). Traders may avoid tight stop-loss placement with the help of the average true range indicator.
The ATR measures volatility and traders reading it can combine it with the placement of a stop-loss to attempt and place a better stop-loss than by just using a concept like support or resistance. Keep in mind though that because indicators are naturally trailing, you are looking into past data.
The strategy involves adding or subtracting the value of the average true range indicator to or from the value of where you want to place that stop-loss level.
Creating a Ruleset
Rulesets are generally self-made instructions that traders hold themselves to in an attempt to minimize risk. They are common among all traders, but especially among day traders who employ a specific strategy, like scalping.
A ruleset should be strictly followed and a trader should not break from their ruleset unless necessary.
Rulesets usually include a target price range, buy price, sell price, stop-loss, confirmation instructions, and anything else that a trader would follow routinely.
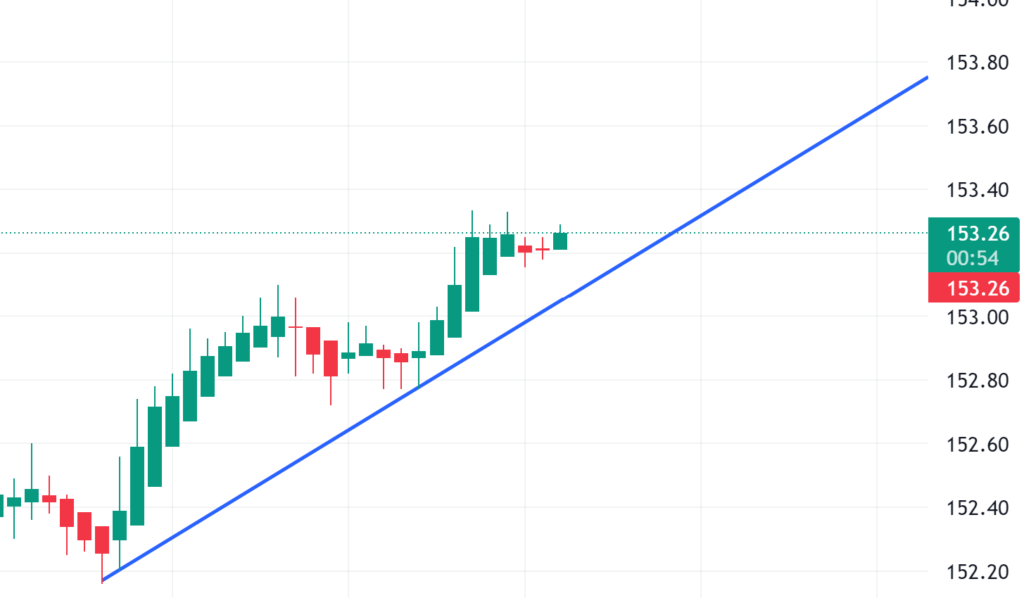
Here’s a sample ruleset for this chart when scalping:
Buy price: When the stock touches the support line (probably around $153.30)
Sell price: 10 cents above buy point (in this case it depends on a trader’s leverage based on their capital)
Confirmation: Bounce off support line and MACD, or other indicators, and a second candle
Stop-Loss: if the stock falls below the support line (find price level)