
The Pipe Tops and Bottoms pattern uses individual candlesticks to determine possible trading opportunities, which can occur on both daily and weekly charts. Yet, Pipe patterns on a weekly chart generally perform better than those on a daily chart.
It may seem similar to a Horn pattern as traders may execute trades based on levels of support or resistance.
Quick Notes:
- The Pipe pattern is a reversal pattern.
- The top two candlesticks of a Pipe Tops pattern are called a “pipe” with the first candlestick bullish and the second candlestick bearish.
- The bottom two candlesticks of a Pipe Bottoms pattern are also called a “pipe” with the first candlestick bearish and the second candlestick bullish.
- On a Pipe Tops pattern, a may reversal be signaled when a candle closes below the lowest low of the two candlesticks that make up the pipe.
- On a Pipe Bottoms pattern, a reversal may be signaled when a candle closes above the highest high of the two candlesticks that make up the pipe.
The Pipe Tops Chart Pattern
The Pipe Tops pattern usually begins with an uptrend which eventually consolidates on the top. This consolidation forms the “pipe.”
The two tops of the pattern consist of first a bullish candle followed by a bearish candle. This forms the shape of a pipe, as the two top candlesticks are obviously secluded from the rest of the pattern, in terms of size.
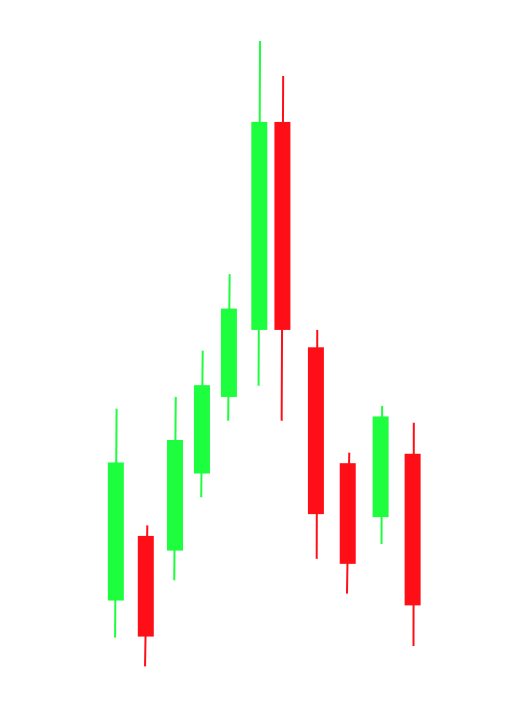
As an observation, the right candlestick in the pipe is a candlestick with lower volume than the left candlestick. According to ThePatternSite, this is an observation of price action but not a requirement of the pattern.
How to Trade the Pipe Tops Pattern
Trading the Pipe Tops pattern is interesting as it may be more likely to employ more speculator trading than some other patterns. Speculators are types of traders who purchase stock for a very short amount of time.
This idea comes from Pipe Tops during a downtrend. Pipe Tops during a downtrend perform better than Pipe Tops during an uptrend because of short pullbacks in price.
To trade this pattern, an identification of the pipe should be discovered. There are two ways to trade a Pipe Top pattern covered here.
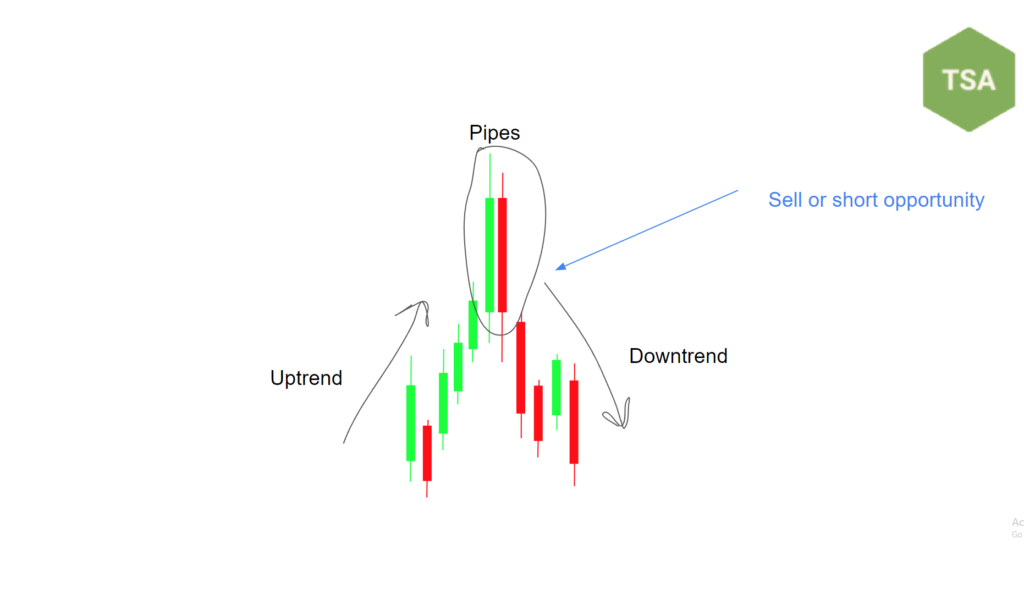
When identifying a pipe on the top of an uptrend, traders may enter into a short position to profit off of a potential downtrend. Traders may also see this as a selling signal if they are holding shares.
Another strategy is not unfamiliar to those who know the Horn pattern or those who understand the concept of support and resistance.
The two candlesticks that form the pipe of the pattern also form levels of support and resistance. A significant support level for this strategy is the lowest price that is created in this pipe or the lowest price of the two lows of the top candlesticks.
Traders may then be on alert for a breakout and may be waiting for confirmation because this support level acts as a reversal point.
If a candle shows confirmation of a breakout to the trader, it may be a sign of a reversal in the trend, and an opportunity to short or sell. Confirmation in this chart pattern usually takes place when a candle closes below the lowest of the three lows.
Learn more on confirmation here.
Confirmation for many traders on this pattern is when price closes below the support level created by the pipe. When this happens traders may enter into short positions or sell their shares, driving the price down.
The Pipe Bottoms Chart Pattern
The Pipe Bottoms pattern is essentially the opposite of the Pipe Tops pattern. The Pipe Bottoms pattern begins with a downtrend which then forms the pipe at the bottom of the trend.
The first candlestick in this pipe is a bearish candlestick, and the second candlestick is bullish. The pipe generally shows volume which is above average on one or both of the candlesticks.
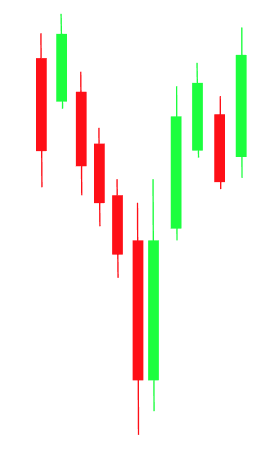
Again, these pipes are obviously secluded from the rest of the trend, in terms of size.
How to Trade the Pipe Bottoms Pattern
Trading the Pipe Bottoms pattern is again similar to trading the Pipe Tops pattern as they both create a pattern-significant level of support or resistance. In the case of a Pipe Bottom, a pattern-significant level of resistance is formed.
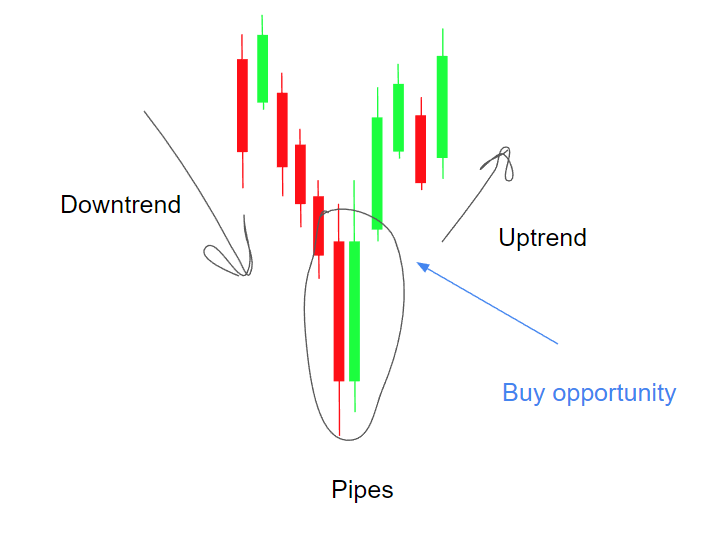
This resistance line is found at the highest high created by the two candlesticks in the pipe. So, in the case of this diagram here, a level of resistance is formed at the high of the bullish candlestick inside the pipe.
If price shows confirmation to the trader, which usually comes in the form of price closing above this resistance level that is formed, then it may be seen as a buying opportunity for the trader.
Another strategy is traders recognizing that a pipe on the bottom of a trend has formed, and entering a buy position based on the candlestick pattern in the pipe formation.
Overall, the Pipe pattern is a very distinct pattern that can be leveraged to find and possibly predict reversals in a trend.
In chart patterns, there is always risk, so trade at your own risk.