
Moving averages (MAs), are one of the most well-known yet unused technical indicators. They are generally used to smooth out price data and show the average price, but there are several ways that they can be used for trading.
Moving averages allow traders to employ many strategies, some of which are well-known and some of which are specific.
Moving Average Types
Keep in mind that like most indicators, moving averages are based on past prices because they take the average of the past prices, making them lagging. This may affect trading.
Moving averages have something called a period, or a lookback period. This is the time that the moving average takes into account for its calculation.
Popular moving average pairs are the 12-period with the 26-period, and the 50-period and the 200-period.
Simple Moving Average (SMA)
The calculation for the SMA is fairly simple. For example, if a trader wants to calculate a 50-day moving average, the trader would take the closing prices of the past 50 days, add them all together, and divide by 50. This would find the average price for the last 50 days.
This calculation for the moving average provides equal weight to all prices, which may be a disadvantage to some traders because the simple moving average would react slower to rapid price changes. For this reason, traders may use another moving average type.
Exponential Moving Average (EMA)
The exponential moving average, or EMA, provides more weight to recent price changes because it is calculated differently than a simple MA. This allows it to react quicker to recent prices.
The EMA is often referred to as the exponentially weighted moving average.
Weighted Moving Average (WMA)
The weighted moving average, or WMA, also provides more weight to recent price changes.
The difference between the WMA and the EMA is that the weighted moving average calculates with linearly decreasing importance on closing prices and the exponential moving average calculates with exponentially decreasing importance on closing prices.
Smoothed Moving Average (SMMA)
A smoothed moving average, or SMMA, is just like a simple moving average, except order prices are never removed.
For example, in a 50-day moving average, the indicator takes the closing prices of the last 50 days and calculates the average.
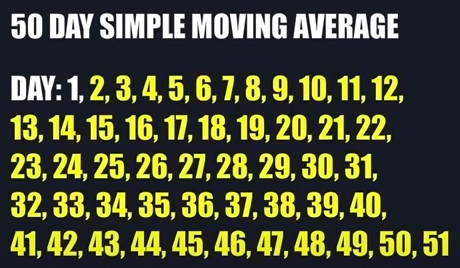
On the 51st day, the simple moving average still takes the last 50 days, meaning that there is 1 day left out, which is the most extreme one in the past.
Notice how in the image above, day 1 is not included in the set as only 50 days are taken into account for the calculation.
The smoothed moving average doesn’t leave out any days, so the old prices are never removed and only have a minimal effect on the moving average.
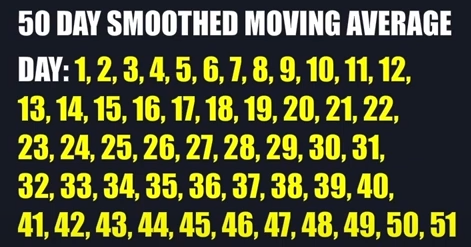
Notice how in the image above, all of the days are included in the calculation for the smoothed moving average.
Exponentially Smoothed Moving Average
As the name suggests, this moving average combines the properties of the exponential moving average and the smoothed moving average.
The moving average not only includes all historical closing prices as the SMMA does, but it also increases the importance of newer prices as opposed to older ones.
Trend Strategy
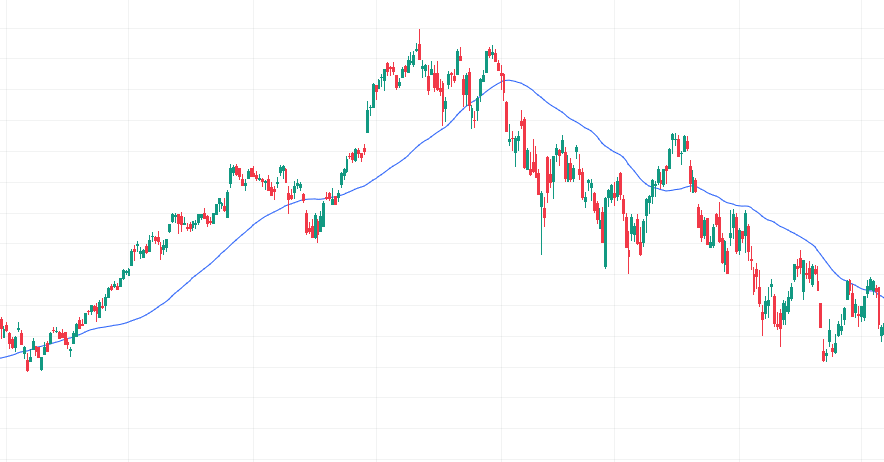
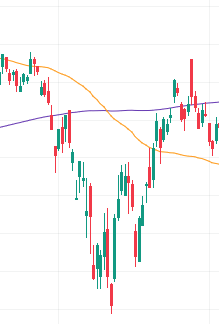
The position of the simple moving average may be used to determine trend direction.
If the price is trading above the moving average it is said to be in an uptrend, and if the price is trading below the moving average it is said to be in a downtrend.
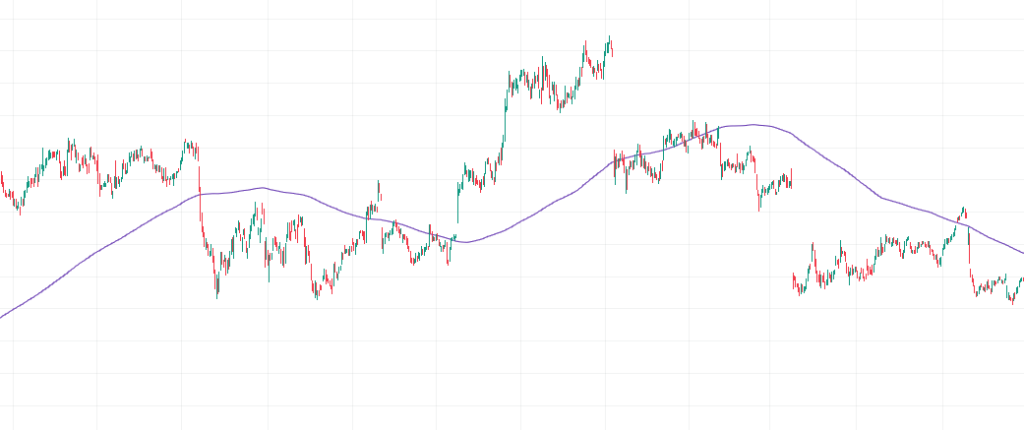
When price breaks the moving average, it usually signals a reversal of the trend.
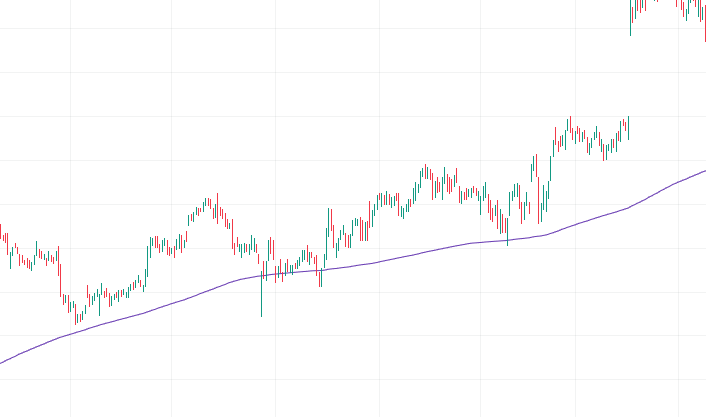
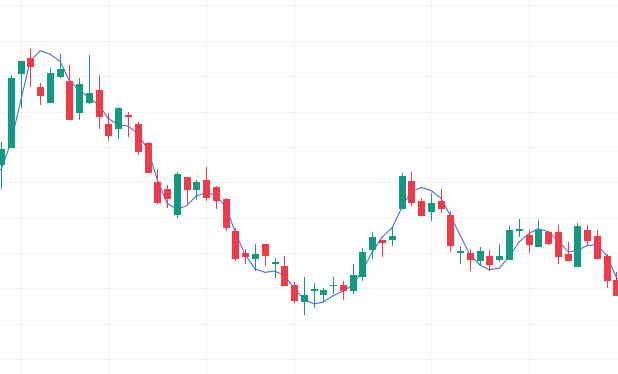
Support and Resistance Strategy
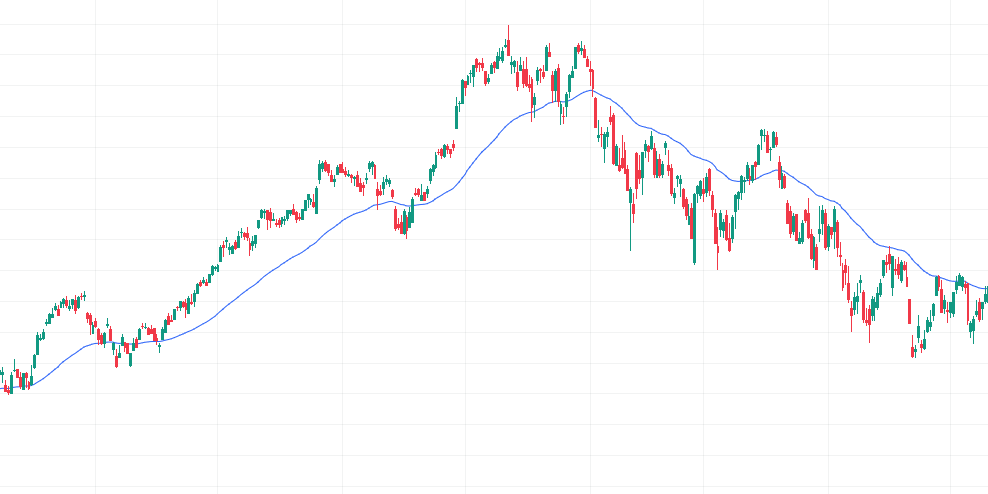
The concept of support and resistance can also be used with moving averages.
Just like a line of support or resistance, if price hits a moving average, it may struggle to break through, again, reinforcing a trend reversal strategy.
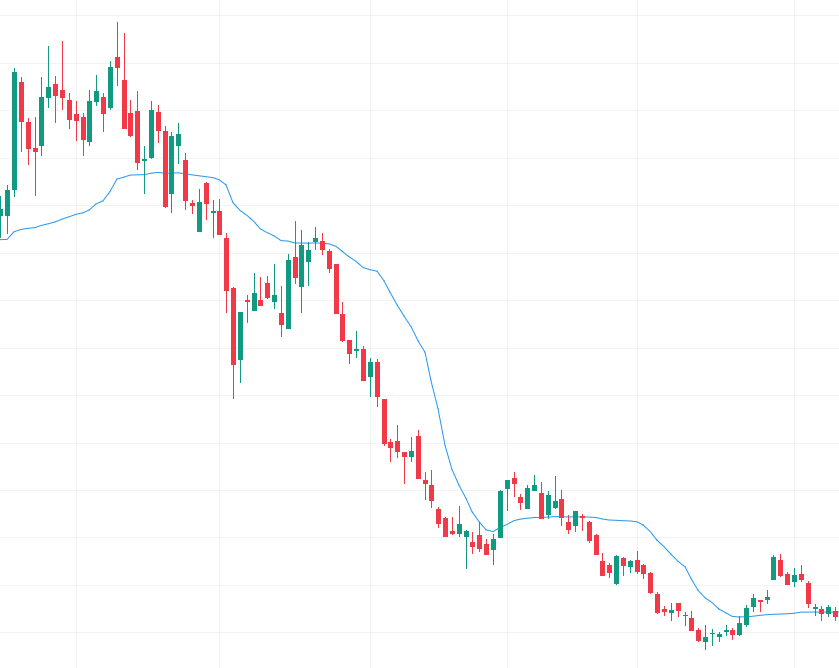
Moving Averages Crossover Strategy
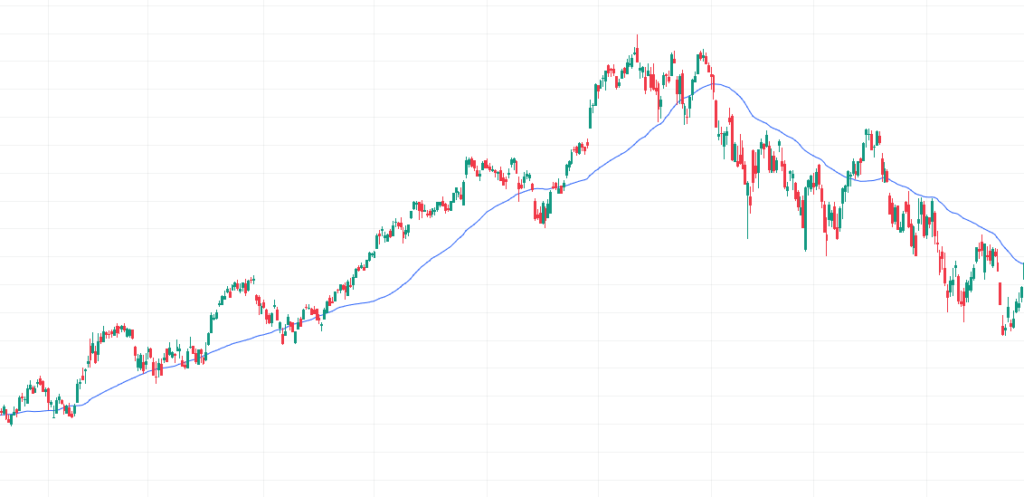
Another reversal strategy is the crossing of the moving averages. When a relatively short-term moving average moves above a long-term moving average, it is said to be a golden cross. A golden cross signals a bullish trend.
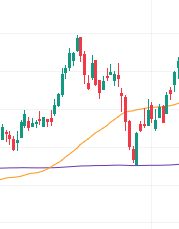
The opposite of a golden cross is a death cross, which is when a short-term moving average crosses below a long-term moving average. This signals a bearish trend.
More Types of Moving Averages
DEMA, Hull Moving Average, KAMA, and TEMA.
Double Exponential Moving Average (DEMA)
This indicator uses two exponential moving averages in an attempt to eliminate lag, further than a traditional EMA.
Developed by Patrick Mulloy, DEMAs primarily are used to determine trend strength and direction and identify potential reversals. They also are used in the line crossing strategy and carry the concept of support and resistance levels.
They are generally used by day and swing traders, those who want quicker reactions to price action.
Hull Moving Average (HMA)
This moving average, developed by Alan Hull, is so fast, that it almost eliminates indicator lag. It also further smoothens out the moving average.
The HMA has a special type of strategy, partly because it is so reactive.
If a short-term HMA turns upwards, then the signal is a long-term entry, and if a short-term HMA turns downwards, then the signal is a falling trend.
If a long-term HMA is rising and the price is also rising, it may indicate a long-term entry, and if a long-term HMA is falling and the price is also falling, it may indicate short potential.
The calculation for the Hull Moving Average, according to Fidelity
- Compute a WMA with period n / 2 and multiply it by 2
- Compute a WMA for period n and subtract if from the first step
- Compute a WMA with period sqrt(n) using the data from the second step
Kaufman’s Adaptive Moving Average (KAMA)
This moving average was developed by Perry Kaufman, and it adjusts the distance at which it follows price action according to the swing size.
If price swings are relatively small and it has low noise, then the KAMA is expected to follow price closely, and if price swings are wider, the KAMA is expected to follow price from a greater distance.
When calculating Kaufman’s Adaptive Moving Average, these standard settings are used:
- 10 = the number of periods for the Efficiency Ratio
- 2 = the number of periods for the EMA fastest
- 30 = the number of periods for the EMA slowest
The Efficiency Ratio
The KAMA uses something called the Efficiency Ratio (ER), in its calculation. The ER has a lookback period, and it is used to determine trending conditions with a range of 0.0 to 1.0.
If the value of the Efficiency Ratio is on the higher side, then it possibly indicates stronger trending conditions, and if the value of the ER is on the lower side, then it possibly indicates weaker trending conditions.
The calculation of the ER is change/volatility.
According to Fidelity:
Change is Absolute Value(Close - Close (10 periods ago))

Volatility is Sum10(Absolute Value(Close - Prior Close))
The Smoothing Constant (SC)
This part of the KAMA calculation makes use of the ER and two smoothing constants based on an exponential moving average.
The Smoothing Constant has different speeds that can be applied to it, as the fastest is the SC for a shorter EMA (a 2-period EMA), and the slower is the SC for the slowest EMA (a 30-period EMA).
SC = [Efficiency Ratio x (SC fastest – SC slowest) + SC slowest]^2
Final KAMA Calculation
KAMA(current) = KAMA(prior) + SC x (Price – KAMA(prior))
Using the KAMA, traders use a theory that future trends will continue to develop in the same direction as the past trends have developed, and trade by that.
Also, when the KAMA line is moving higher, it signals an uptrend, and when the KAMA is moving lower, it signals a downtrend.
Triple Exponential Moving Average (TEMA)
Similar to the Double Exponential Moving Average (DEMA), the TEMA uses three exponential moving averages in an attempt to eliminate lag, further than a traditional EMA. This may make it easier to identify trends.
Generally, when price is above the TEMA, it signals an uptrend and when price is below the TEMA, it signals a downtrend. This may help analyze trend changes.
If the TEMA changes position from above to below the price, or below to above the price, it may signal a reversal of the trend.
So, if the TEMA moves from above to below the price, it may signal a potential uptrend, and if the TEMA moves from below to above the price, it may signal a potential downtrend.
Support and resistance levels can also be found at the TEMA.
A line crossing strategy may also be incorporated using the TEMA.