
We often see new supply and demand traders mark out every zone and identify every imbalance on the chart.
While this isn’t necessarily wrong technical analysis, it often leads to confusion and failed trades.
This article will cover two ways of identifying possibly highly tradable supply and demand zones as opposed to zones that are less likely to be reliable.
Identifying Good Zones
First, let’s cover what “highly tradable” means. Highly tradable is simply a way to refer to a supply or demand zone that traders often see as more reliable or stronger than other zones.
This can of course depend on the trader’s strategy, but there are two common techniques that traders employ to identify these stronger zones.
Price Imbalance
What do traders look for when first identifying a supply or demand zone? A large imbalance in price which represents institutional involvement.
The problem is, many inexperienced traders choose every single imbalance as a zone to trade at. As we will see in a second, some imbalances represent stronger supply or demand areas than others.
First, we need to understand what often happens when institutions step into the market.
Institutional Involvement
Institutional buying or selling usually creates a rally or drop in price which represents an imbalance between buyers and sellers, because this “smart money” has so much capital.
When these sharp price moves happen, unfilled buy or sell orders are often left in these zones, usually for these same institutions to come back and fill.
In a demand zone, unfilled buy orders are left.
In a supply zone, unfilled sell orders are left.
The aim of the retail trader is to identify where these orders are left and to form a zone around them.
Large Imbalances
Experienced supply and demand traders usually draw highly tradable zones around areas where there was a very strong rally or drop. Something like this:
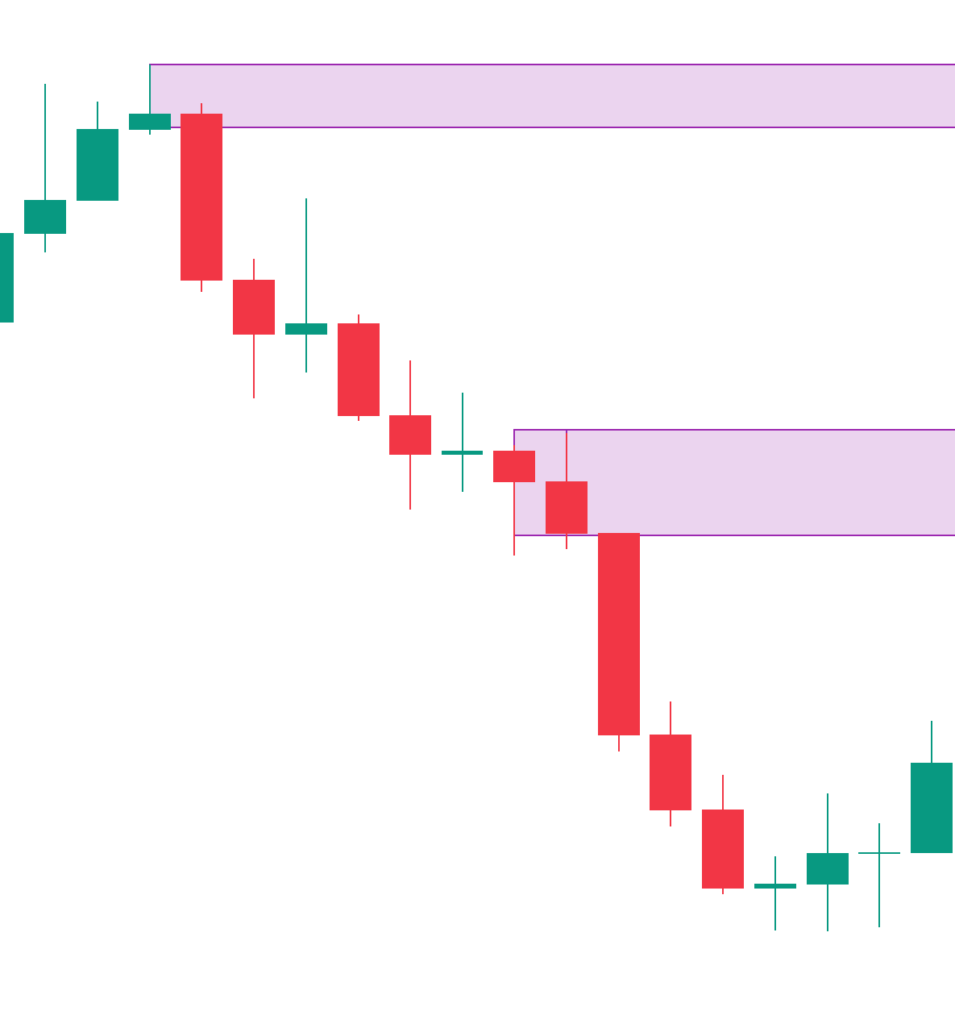
Notice the size of these bearish candles that came after the two supply zones, as opposed to the rest of the candles. This is a strong imbalance and these may be marked as highly tradable zones.
Here’s another example of a strong imbalance in price:
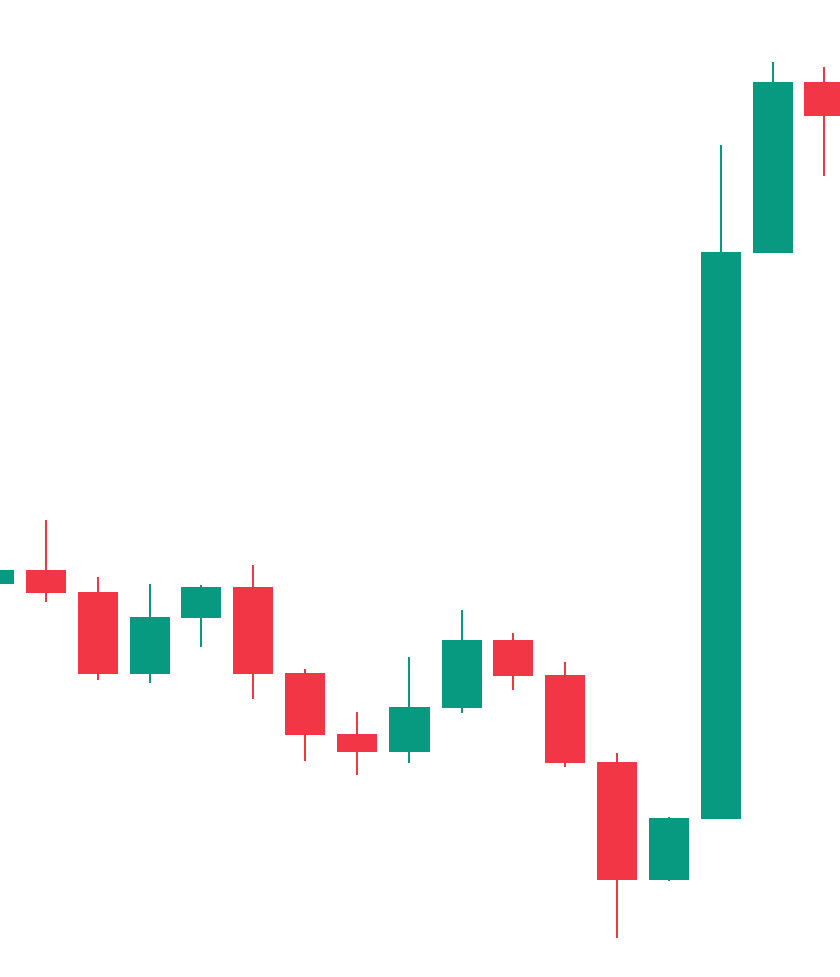
Notice the size of that bullish candle compared to the rest of the candles. This is institutional buying, which most likely left unfilled buy orders waiting to be picked up.
Zone Removal
Another technique that is often used in conjunction with the identification of large imbalances is the removal of opposing zones.
So, if a demand zone forms and the rally after the demand zone eliminates an opposing supply zone, then a trader may label that demand zone as a highly tradable zone.
On the contrary, if a supply zone forms and the rally after the supply zone eliminates an opposing demand zone, then a trader may label that supply zone as a highly tradable zone.
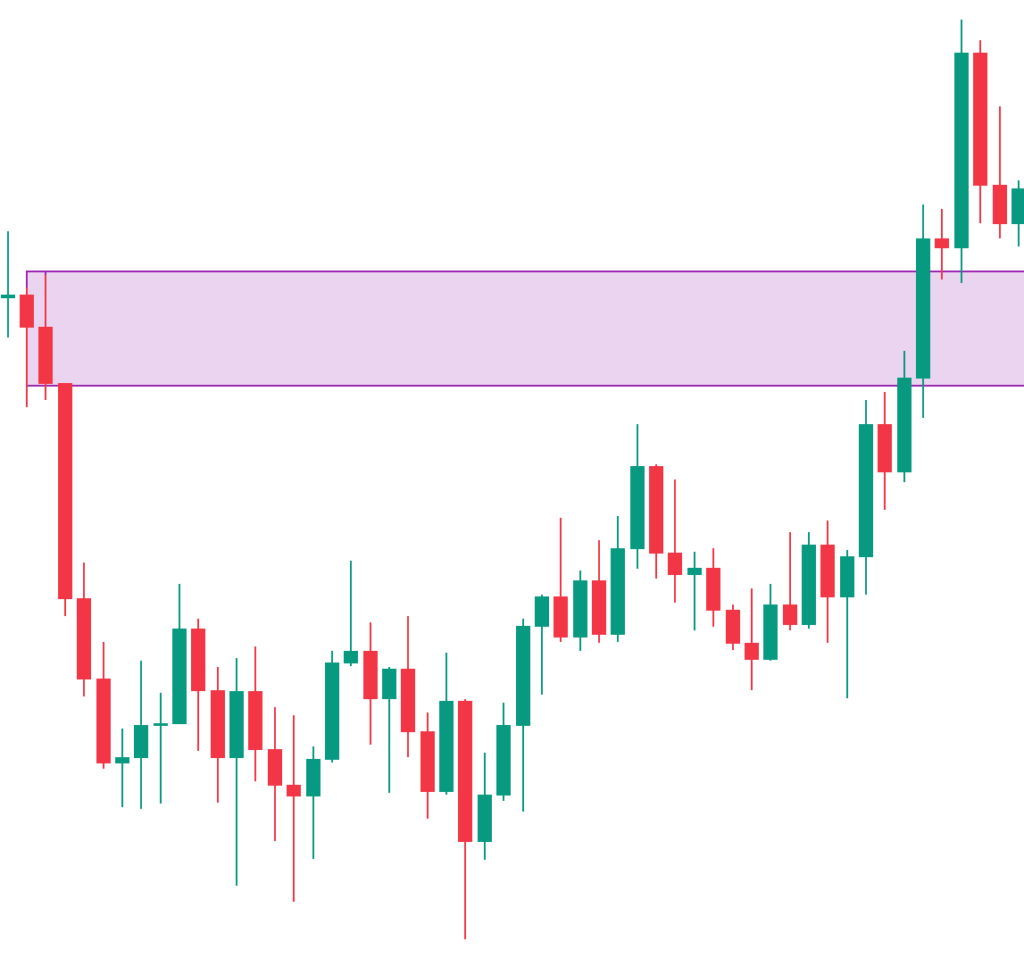
The words “removes” or “eliminates” or “takes out” in this case, all refer to when price pushes past and such invalidates a zone.
In this chart, we see how price fully pushes past this supply zone. Price “takes out” or “removes” or “eliminates” this supply zone.
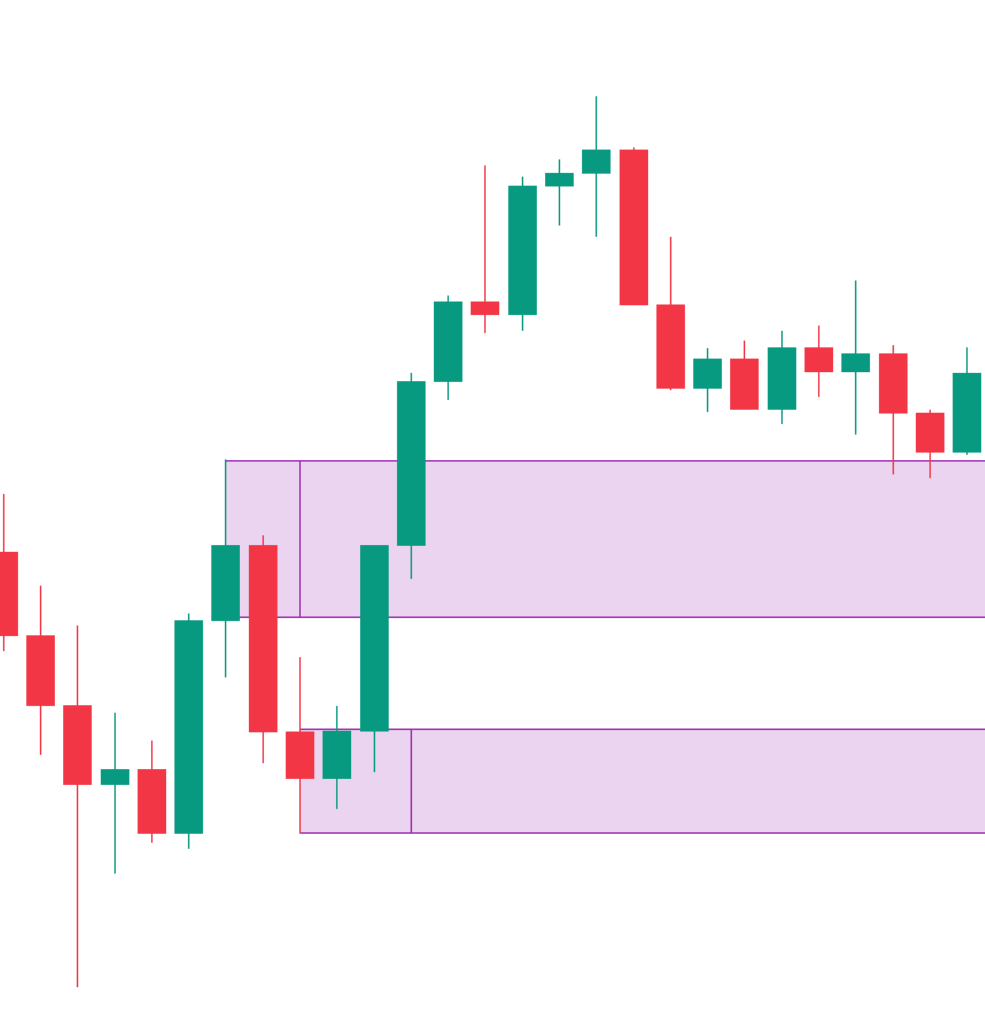
In this chart, we see how price creates a demand zone with a large imbalance and removes an opposing supply zone. This may be labeled by traders as a highly tradable zone because of the confluence of techniques.
Overall, it’s important to understand why traders choose some supply or demand zones over others and why some zones may perform better than others.
Want to trade like the banks? Join The Special Prelaunch Deal For Our Course!
If you have any questions, you can leave a comment or join our Discord server.
Thank you! Hope you enjoyed!