
While there are many possible chart patterns and concepts that scalpers use to trade, these simple yet effective patterns that may be a scalper’s dream.
Scalping is a certain trading style where traders specialize in making quick trades off small price changes. It uses the concept of support and resistance heavily and can incorporate indicators and chart patterns.
Also Read – Scalping Day Trading – Highly Effective Strategies
How Does Scalping Work?
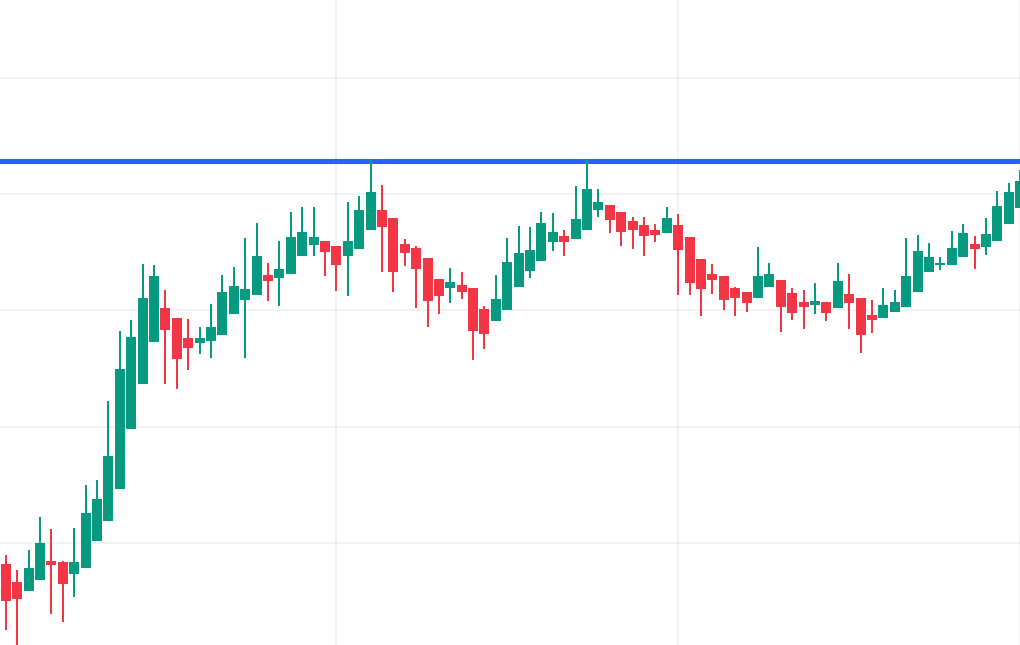
When scalping, traders find a chart, often a candlestick chart, and may identify points of support and resistance and swing highs and lows. So, on the chart above, we see that the stock is expected to hit the line of support again, and if it does, traders may buy at the point of support.
Scalpers who buy at the support line will likely sell quickly, as they usually leverage large amounts of capital and can day trade with a few cents.
How Much Money Do I Need to Trade Stocks?
So, now that we understand that the support line is a demand zone and that other traders are doing the same thing, we can understand how traders use scalping to make quick profits.
Traders can also do the same thing, but by shorting. Here, we can see that the stock bounced off the resistance line, providing the opportunity for the trader to short.
Now that we’ve covered what scaping is and how scalpers trade, let’s get on to the chart patterns.
Horn Tops and Bottoms Chart Pattern
The Horn Tops and Bottoms pattern, while utilizing the same concept of support and resistance, it goes in-depth into the individual candlesticks of the pattern. The Horn pattern also utilizes the concept of a breakout to catch a reversal.
The Horn pattern is a reversal pattern that has two types: The Horn Tops, and the Horn Bottoms.
The three candlesticks that make up the head of the pattern create three lows. When trading the Horn Tops pattern, traders look for the lowest of the three lows.
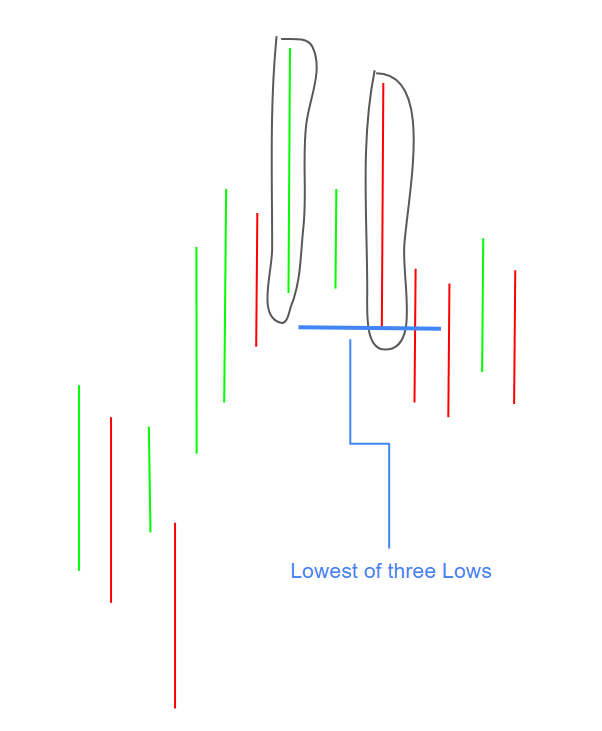
In this case, the candle to the right (the right horn), has the lowest point. This low creates a significant level of support.
Traders may then be on alert for a breakout and may be waiting for confirmation because this support level acts as a reversal point.
If a candle shows confirmation of a breakout to the trader, it may be a sign of a reversal in the trend, and an opportunity to short or sell. Confirmation in this chart pattern usually takes place when a candle closes below the lowest of the three lows.
Learn more about the Horn Pattern and the Horn Bottoms pattern.
Three Rising Valleys Chart Pattern
The Three Rising Valleys (3RV) pattern is a breakout pattern. It is often seen in the stock market due to its simple identification, where the main part of the pattern is three valleys, each consecutive valley creating an area of support high than the previous valley.
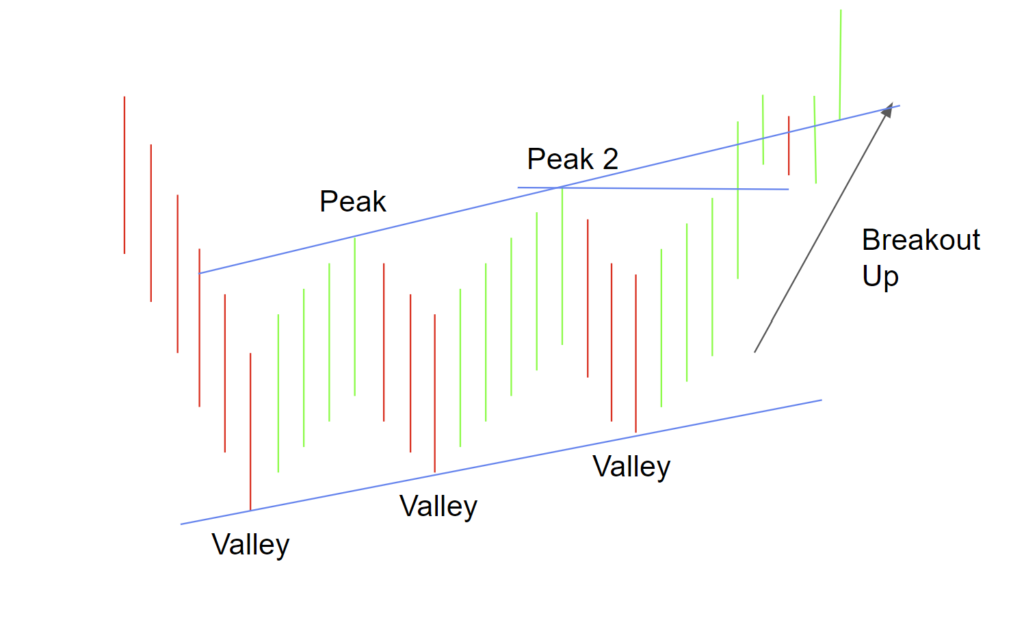
The Three Rising Valleys pattern chart pattern uses the concept of support and resistance to find potential uptrends and downtrends. Most importantly, it also uses support and resistance as a confirmation strategy, which is the basis of this chart pattern.
In this pattern, price bounces off the third valley level, which is higher than the previous two valleys, and moves up towards a defined level of resistance. This is where many traders pay close attention.
This resistance level is the high of the highest peak that the price creates. As price moves up and/or closes above this level of resistance, traders may start envisioning their trades.
If price breaks through this level of resistance, traders may enter into a buy position on the security, hoping for a continuation of this uptrend, and a potential breakout, or in other words, reversal of the overall current trend.
Scalpers may trade the bounces on the support and resistance lines, and the breakout.
Three Rising Valleys Chart Pattern
Three Falling Peaks Chart Pattern
An almost opposite to the Three Rising Valleys pattern is the Three Falling Peaks pattern. The pattern is a breakout pattern where the breakout is bearish.
The pattern begins with an uptrend, which is followed by three peaks in price and then returns to the downside after the breakout. It also includes the concept of support and resistance.
As said before, the Three Falling Peaks pattern is preceded by an uptrend which leads into the first peak. The first peak is followed by two more peaks, each one lower than the next. These peaks often bounce off of a line of resistance, which can aid scalpers.
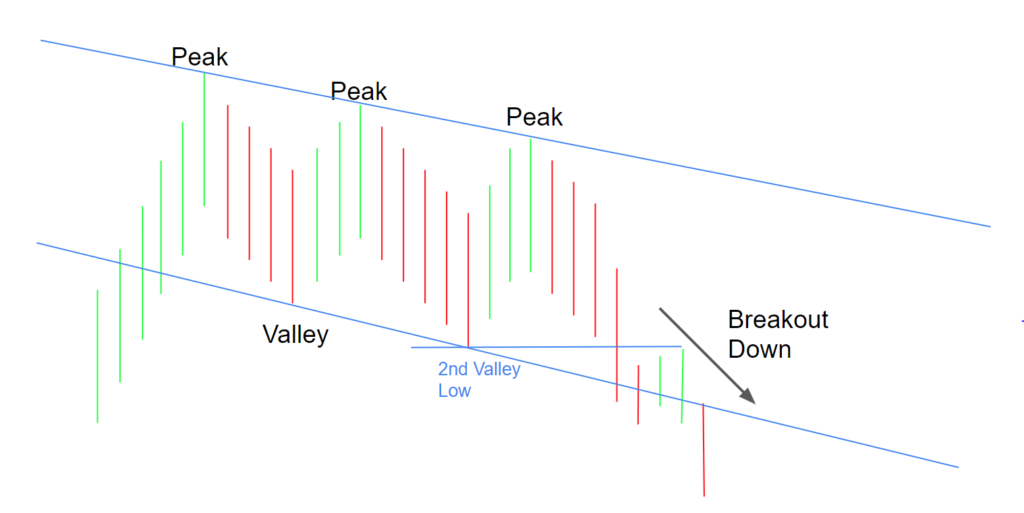
Each peak should look similar to each other peak, according to ThePatternSite.com. This symmetry in price encourages a correct pattern label.
The bottom between the two peaks is sometimes referred to as valleys, as this pattern is similar to the Three Rising Valleys chart pattern.
The valleys create support levels which are often used to trade and predict this pattern, as well as the breakout and further trading opportunities.
Learn how to trade the Three Falling Peaks pattern
Conclusion
Overall, these patterns are effective at providing multiple points for scalpers to find trading opportunities. To read these charts, head over to a charting platform. Here are a few:
TradingView
TradingView is one of the most popular online, free, and compact charting platforms. To view a stock with a candlestick chart, enter the stock’s name or ticker in the search bar and press enter. Then, press the button in the top left, next to the “Indicators” button that looks like this:

Then, press on “Candles”. Some may prefer to use the Heikin Ashi candles discussed above, as they may seem simpler.
Yahoo Finance
Another popular online charting software, powered by Yahoo. To access the candlestick chart, search up a ticker in the top search bar of the homepage, double click on the area chart, press the button that looks like this:

And choose “Candle”.
Stock Charts
Stock Charts may be a bit confusing for beginners, but it is very compact with features. To access a candlestick chart, search up a ticker in the search bar, and wallah, a candlestick chart has appeared. You can change the settings as you wish.