
Some traders may consider this pattern to be their favorite trend change pattern. Like the Three Falling Peaks pattern, the Three Rising Valleys (3RV) pattern is a breakout pattern.
It is often seen in the stock market due to its simple identification, where the main part of the pattern is three valleys, each consecutive valley creating an area of support high than the previous valley.
The Three Rising Valleys Pattern
The Three Rising Valleys pattern chart pattern uses the concept of support and resistance to find potential uptrends and downtrends. Most importantly, it also uses support and resistance as a confirmation strategy, which is the basis of this chart pattern.
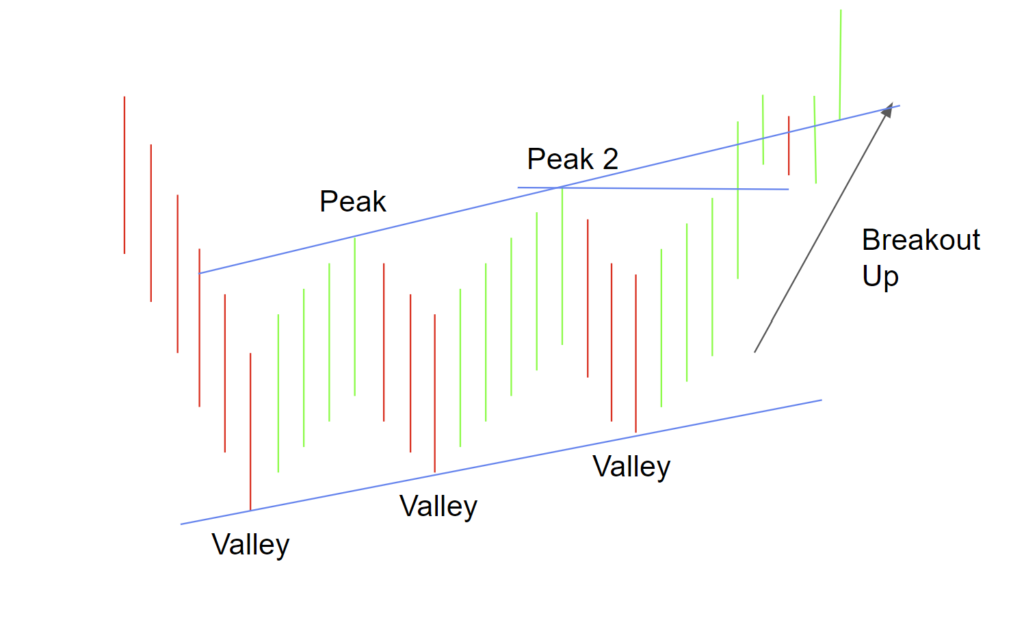
The pattern begins with a downtrend, which finds or creates an area of support. This is the first valley.
It then moves up to create a peak, then down to create another valley which is higher than the previous, and back up for another peak, and then back down for one more valley.
In this pattern, price bounces off the third valley level, which is higher than the previous two valleys, and moves up towards a defined level of resistance. This is where many traders pay close attention.
How to Trade the Three Rising Valleys Pattern
This resistance level is the high of the highest peak that the price creates. As price moves up and/or closes above this level of resistance, traders may start envisioning their trades.
If price breaks through this level of resistance, traders may enter into a buy position on the security, hoping for a continuation of this uptrend, and a potential breakout, or in other words, reversal of the overall current trend.
While traders can buy, sell, and short at the levels of support the chart creates, the main strategy of a trader while observing this pattern is the above technique. Still, these valleys often bounce off of a line of support, which can aid scalpers.
Because this is a pattern that ends in a reversal of a downtrend, it generally performs “very good” in a bull market, according to Thomas Bulkowski.
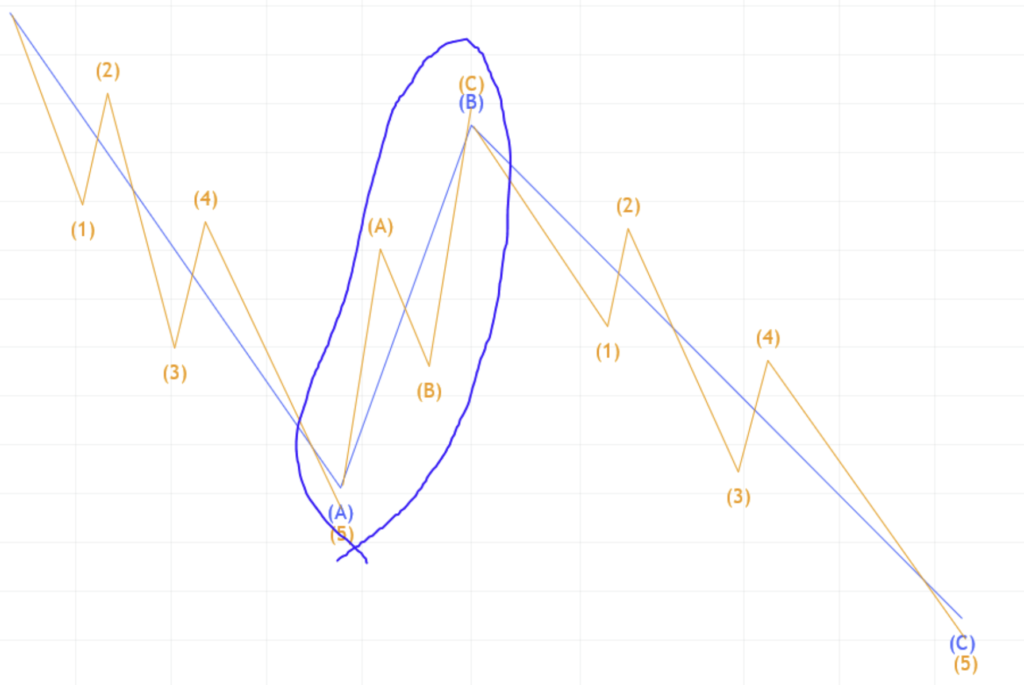
The concept of Elliott Waves may also be incorporated into this pattern, not only through counting the waves, but by recognizing that a Three Rising Valleys pattern might be a corrective wave.
A corrective wave is price movement that is opposite to, or against, the current overall trend. So, this pattern may be a bullish corrective wave to a larger bearish trend.
This corrective wave may turn into the bottom of that period, causing a reversal in the trend, and a overall bullish trend.
A stop loss may also be placed at the low of the most recent valley. This may vary based on many factors such as the security, market sentiment, capital, etc.
Further Statistics
According to ThePatternSite.com, the Three Rising Valleys pattern is seen on either a daily or a weekly chart.
Calculating the target price of the pattern may be done by first calculating the pattern’s height: Price height – the pattern’s lowest price.
Then, adding the pattern’s height to the highest high of the pattern, the breakout level, may compute the target price. While this calculating is useful and is something that should have attention, it is not a guarantee that the price will reach that high or even trend upwards.
While the Three Rising Valleys pattern may be seen frequently on a daily chart, it is wise to improve performance by using other factors and trading tools. This may take form by trading during a bull market and by incorporating indicators like the MACD into trading.