The Pivot Machine Gun (PMG), is a STRAT method strategy that is not very well known in the technical analysis world but also employs the chance of price rapidly increasing or decreasing in a short amount of time to profit.
It works just like the other STRAT combos and it employs time frame continuity.
How to Trade the Pivot Machine Gun
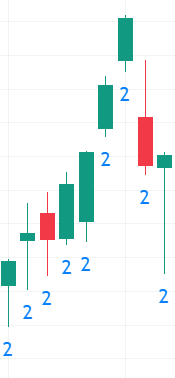
What traders look for are points in the chart where price makes higher lows or lower highs, consecutively. Generally, 5 or more higher lows or lower highs. This may be a 2-2 continuation.
Whether traders look for consecutive higher lows or consecutive lower highs depends on the direction the trader wants to trade.
If the trader is intending to buy, then he or she would look for consecutive lower highs, as the Pivot Machine Gun would be a reversal of that trend. If the trader is intending to short, then he or she would look for consecutive higher lows.
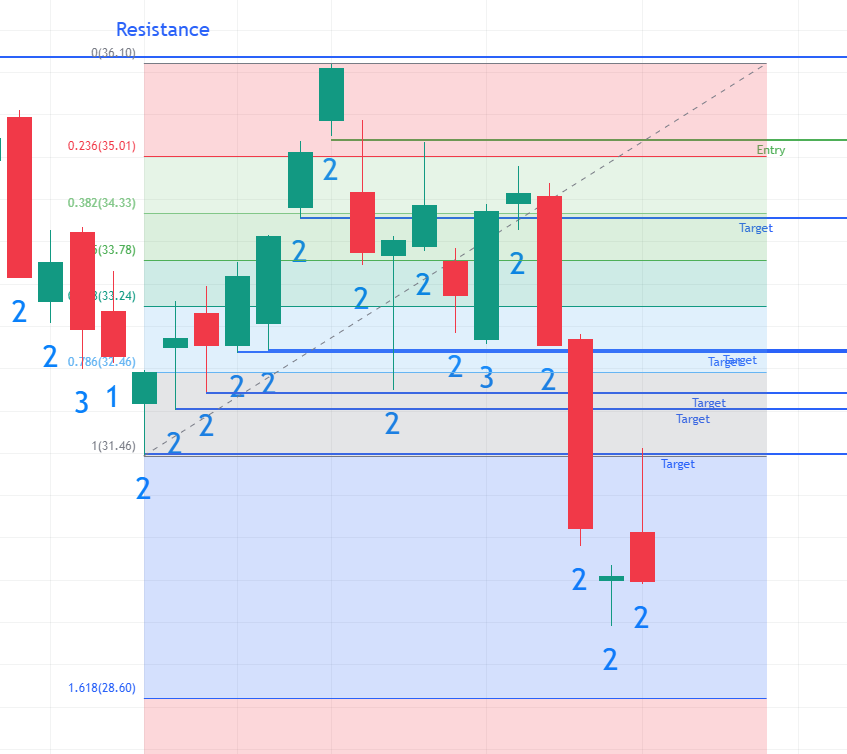
In this example, the chart made consecutive higher lows, with an uptrend of 2 bars. At the top, a Bearish 2-2 Reversal combo can be seen and in 2 days, price takes out four price targets. Let’s look at this example again, but marked up.
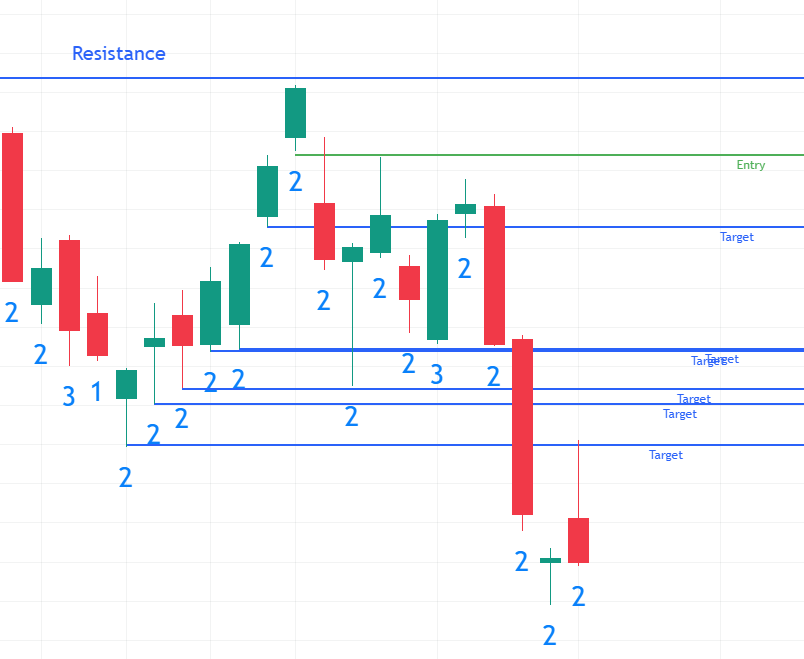
In this chart, which is the same as the previous PMG example, but more price action is shown, an entry price, a resistance line, and target prices are labeled.
The entry price should be 1 cent below the low of the top candle, as traders want to make sure that a 1 candle is not forming.
Traders usually place their target prices at the levels of support, the lows of the previous bars.
We can see that price rapidly broke through the previous price targets on the first 2 days of the reversal, then consolidated a little, then continued downwards to break more target levels and even continued further.
After the first two days of this chart, traders may have moved their stop-loss to the entry price to break even if price came back up to hit it.
Further Notes
As a further note, the Bullish 2-2 Reversal on the bottom of the chart failed to reach the target price of the large red candle, but instead hit the target price of the 2 candle that formed a point of resistance.
The reason for this may be because of the direction of the trend, time frame continuity, and/or because of the line of resistance formed by that 2 bar.
The consolidation is by the usually significant Fibonacci levels. This consolidation can be easily shown by the Fibonacci retracement tool.