
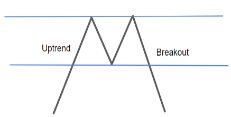
How to Trade the Three Falling Peaks Chart Pattern
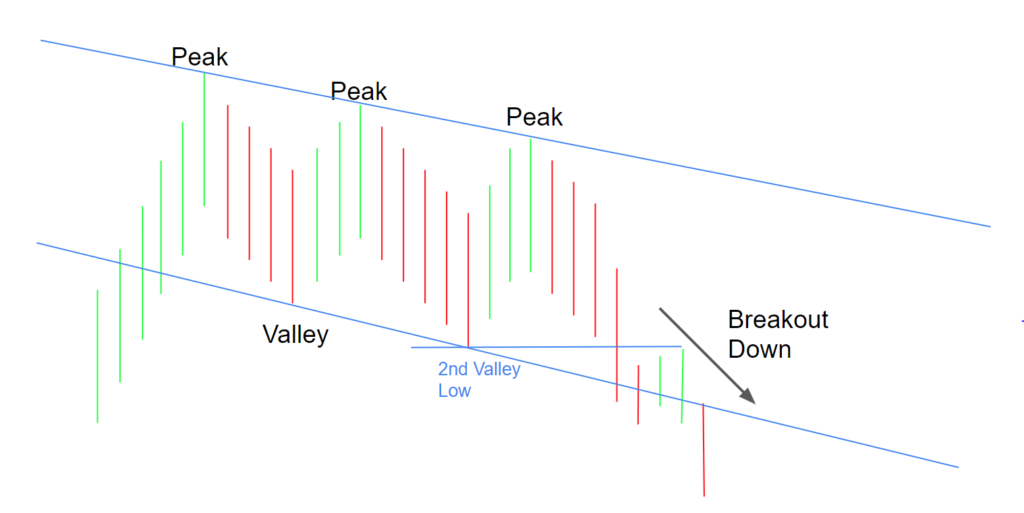
The Three Falling Peaks pattern is a particularly interesting pattern. It is studied by professional traders like Thomas Bulkowski. The pattern is a breakout pattern where the breakout is bearish. The pattern begins with an uptrend, which is followed by three peaks in price and then returns to the downside after the breakout. It also […]
Scalping Day Trading – Highly Effective Strategies
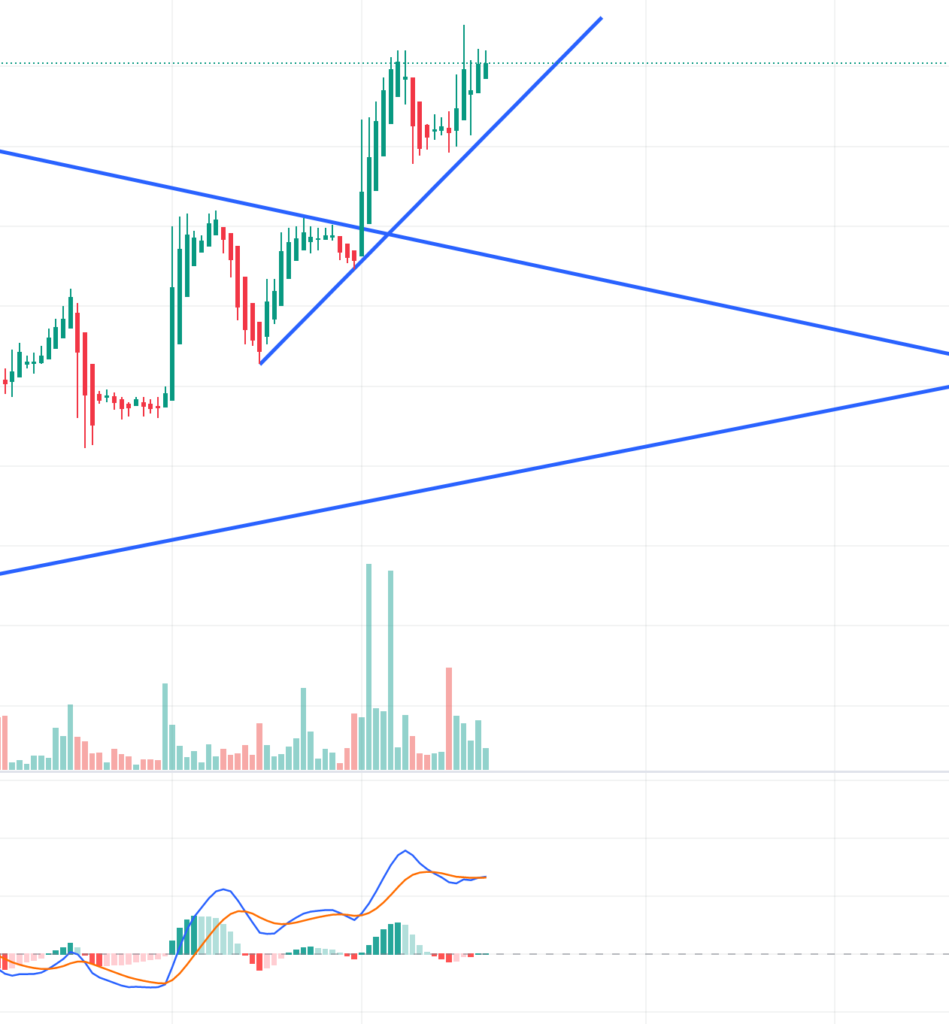
What is scalping and how do professional day traders profit from this strategy? Be sure to read the disclaimer at the bottom before reading this article. Scalping is a certain trading style where traders specialize in making quick trades off small price changes. It uses the concept of support and resistance heavily and can incorporate […]
How to Use The Parabolic SAR – 3 Killer Strategies
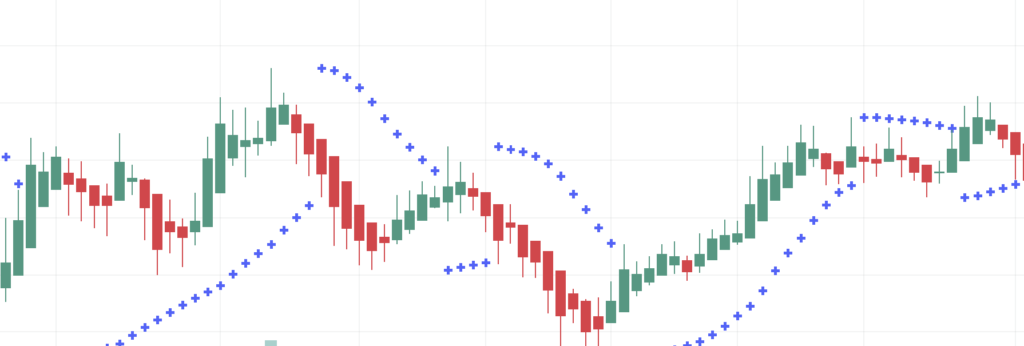
The Parabolic SAR indicator helps the trader determine the direction in which the security is moving, and helps determine possible reversals in the trend. It usually is shown with circles or stars, below the price in an uptrend, and above the price in a downtrend. The Parabolic SAR, developed by J. Welles Wilder Jr., stands […]
What Is a Recession and How to Prepare
This word “recession” is thrown around from time to time, which is sometimes used to create fear and emotions. This type of emotion may not only effect the stock market greatly, but the whole economy. Before we decide what exactly is going on in the market, we have to know what a recession actually is. […]
How to Trade Divergence: Definitions, Strategies, Examples
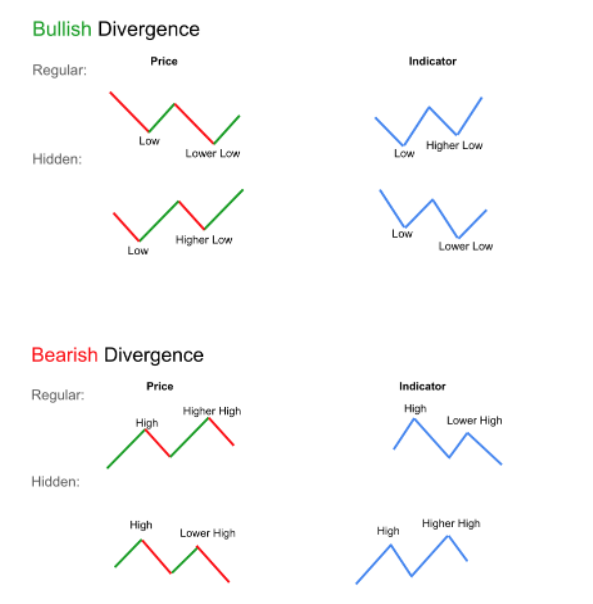
Divergence is a widely discussed topic in the technical analysis world. It can signal potential momentum or potential reversals which is why technical analysts examine this indication extensively. Quick Notes: What is Divergence? Divergence is simply when price moves in the opposite direction of an indicator. Popular indicators that traders use when identifying and trading […]
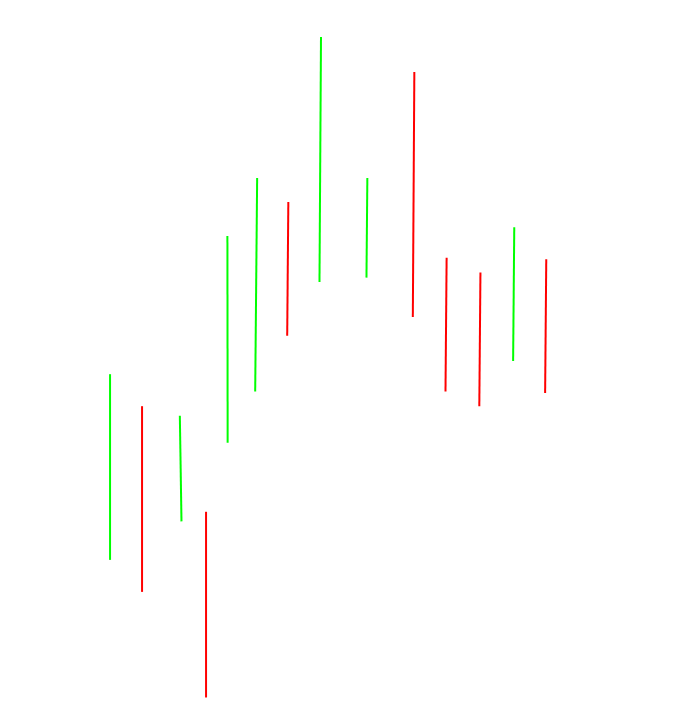
3 Chart Patterns Every Trader Should Know
Those who trade with technical analysis have identified chart patterns in the stock, usually with a candlestick chart. Technical analysts, those who study technical analysis, are able to use these chart patterns in an attempt to predict price movement. Before learning chart patterns though, the traders should understand the concept of support and resistance. What […]
How to Trade the Horn Tops and Bottoms Chart Pattern
The Horn Tops and Bottoms pattern is particularly interesting because while utilizing the same concept of support and resistance, it goes in-depth into the individual candlesticks of the pattern. The Horn pattern also utilizes the concept of a breakout to catch a reversal. The Horn pattern is a reversal pattern that has two types: The […]
How to Trade the Head and Shoulders Pattern
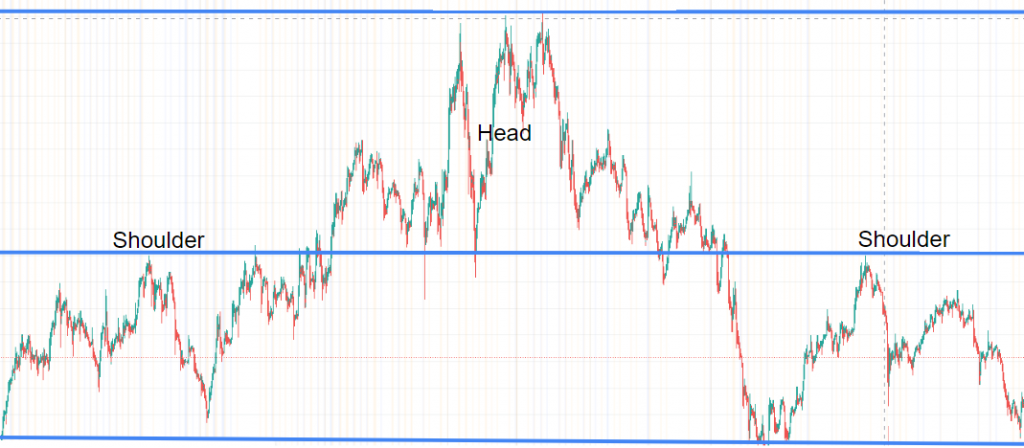
The Head and Shoulders pattern is one of the most well-known patterns in the technical analysis world. It consists of multiple parts with multiple trading opportunities. The pattern utilizes the concept of support and resistance to identify points of reversal and breakout. This pattern is sometimes called the Head and Shoulders Reversal pattern because it […]
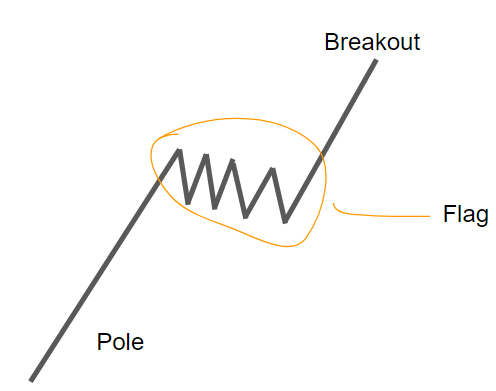
How to Trade the Flag Pattern in the Stock Market
The Flag pattern is a stock market pattern analyzed by technical analysts, those who study technical analysis. It can be related to a corrective pattern in the topic of Elliott Waves because it moves in the opposite direction of the trend. The Flag pattern is called a “Flag” because when created, it resembles a flag. […]
How to Trade Double Tops and Double Bottoms
The Double Pattern is pretty simple, as all of the moves associated with it just use two simple factors: Support and resistance. The Double Pattern is a fairly common pattern when it comes to technical analysis as it can indicate a potential reversal of the trend. If you can master recognizing support and resistance points […]