
The Head and Shoulders pattern is one of the most well-known patterns in the technical analysis world. It consists of multiple parts with multiple trading opportunities.
The pattern utilizes the concept of support and resistance to identify points of reversal and breakout. This pattern is sometimes called the Head and Shoulders Reversal pattern because it results in a reversal of the trend.
Quick Notes:
- The Head and Shoulders pattern is a reversal pattern.
- The Head and Shoulders pattern utilizes levels of support and resistance.
- There is also an Inverted Head and Shoulders pattern.
- The Head and Shoulders pattern can be traded in multiple different fashions.
How to Identify the Head and Shoulders Pattern
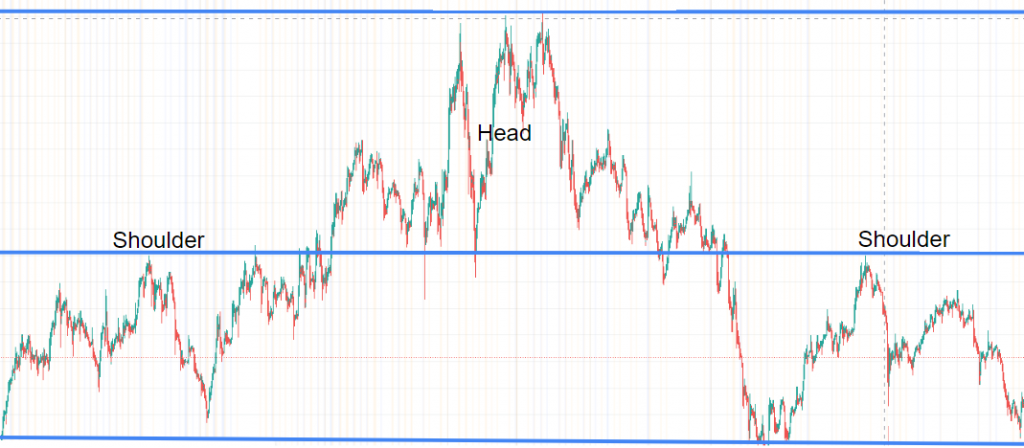
The Head and Shoulders pattern generally can be seen forming a market top, because it is a reversal pattern. It can also move against a current trend, but it is generally seen as less likely to perform like a Head and Shoulders pattern.
If the Head and Shoulders pattern does not reverse, it is not considered a Head and Shoulders pattern. It usually is identified to be created off of an uptrend.
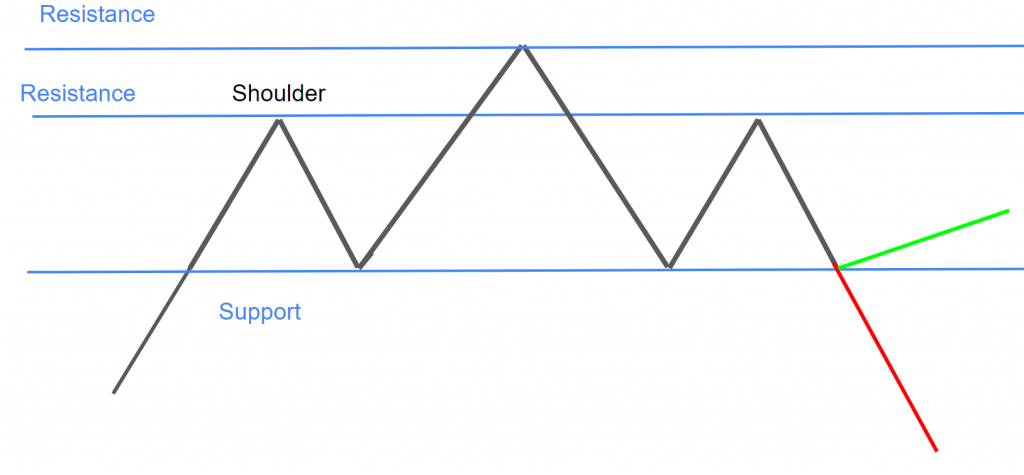
The pattern as shown above has three main parts: The first shoulder, the head, and then the second shoulder. There is also a neck line present below the two shoulders.
As the uptrend hits a point of significant resistance, the peak of the first shoulder forms. The chart then tests and bounces off that price level and often meets this bottom support line (neckline). It doesn’t have to touch the bottom support line, but it should decline far enough to form a trough and should not decline past the bottom support line.
As price starts to move back up, the head portion begins to form. The head is able to break past the resistance line at the peak of the shoulder, but ultimately tests and fails to pass a significant resistance point of its own.
The head can also form a market top, where news or some other factor can push price back into a decline.
As the head portion tests the bottom support line, it may bounce off and form the next and final shoulder. The result of this shoulder decides if price reverses or not.
Generally, the price will reverse as the Head and Shoulders pattern is a reversal pattern, but always be ready to react if price does not reverse. If price does not reverse, then it is not considered a Head and Shoulders pattern.
How to Trade the Head and Shoulders Pattern
Trading the Head and Shoulders pattern is fairly simple because of the levels of support and resistance and the consistency of this pattern, but that does not mean that trading it is any less risky than anything else.
For the first shoulder, the trader may either buy the uptrend and sell at the resistance line, or short at the resistance line and cover at/near the support line.
He or she may buy at the support line and sell at the top resistance line if he or she is expecting a Head and Shoulders pattern to form. The trader may also short from the top resistance line.
The same trading strategy for the first shoulder may be performed for the second shoulder, but this is where many traders may be expecting a reversal. So, the trader may short from the top of the shoulder or short if the price breaks out down.
How to Identify the Inverted Head and Shoulders Pattern
The Inverted Head and Shoulders pattern is very similar to the Head and Shoulders pattern we just learned, except is it inverted. So, many of the moves and the trading strategies work the opposite.
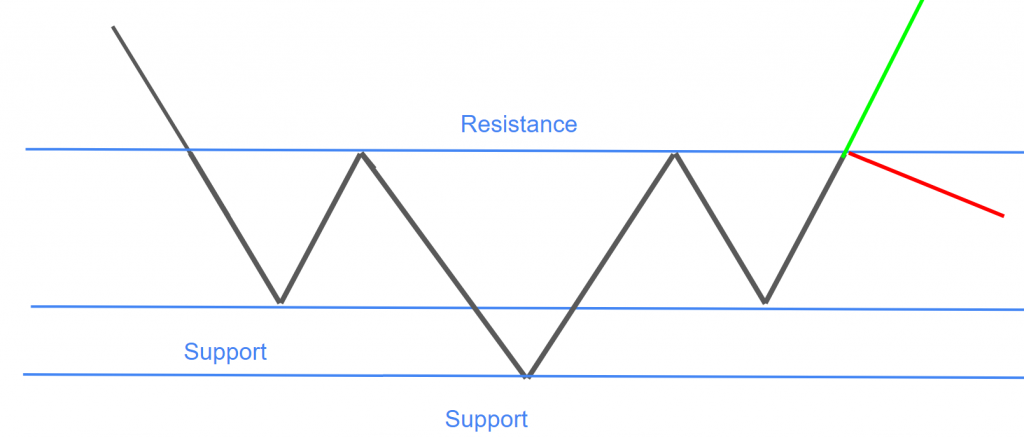
This pattern as shown above also has two shoulders and a head. It generally starts off with a downtrend which leads into the first shoulder part.
As the first shoulder reaches its low, it bounces off the support line and then reverses to the resistance line, which then causes the failing price to fall down and form part of the head portion.
Again, as the head reaches its low, it bounces off and moves up to the resistance line, and then the second shoulder is formed.
The result of the second shoulder is generally a reversal of the trend to the upside, but it may not reverse, and the trader has to be prepared for that.
How to Trade the Inverted Head and Shoulders Pattern
Traders may short the downtrend and cover at the support line, or buy at the support line and sell at the resistance line for the first shoulder.
The trader may also short at the resistance line and cover at the support line for the head or the second shoulder. He or she may also buy at the support line and sell at the resistance line.
The trader may also wait for a breakout and buy the reversal of the trend.
Calculating a Breakout
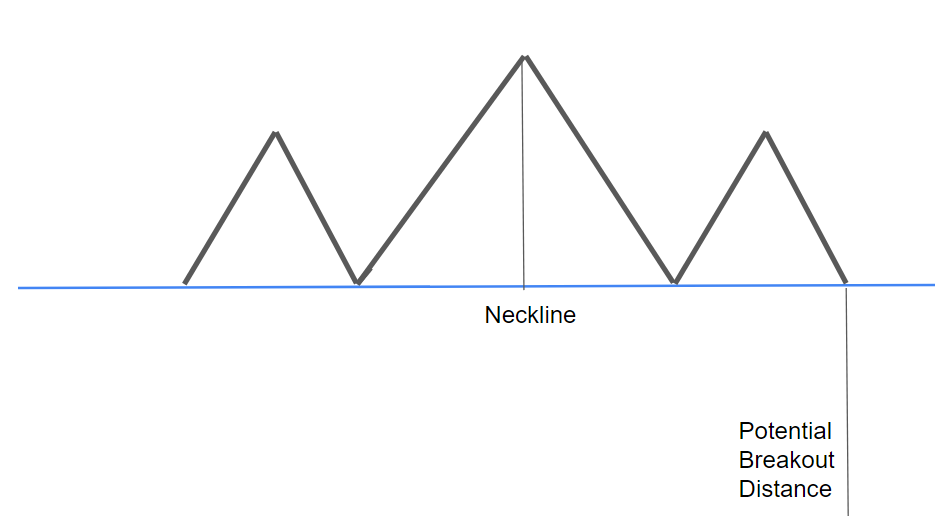
Predicting how far a price is expected to move on a breakout is a trick many traders try on chart patterns. They are not 100% successful, but having a target price is a smart rule to add to a ruleset because it may minimize greed. Be careful not to increase greed with the ruleset.
Potential Breakout distance of a Head and Shoulders pattern may be calculated by finding the distance between the highest or lowest point of the head part and the neckline. Then, taking that amount and adding it to the point of breakout.
How to Confirm a Breakout
Traders, when watching a potential breakout, usually have a way to distinguish a breakout from a test and a bounce. This is called confirmation.
The trader may look for confirmation on a potential breakout and it can depend on the trader.
Candlestick Confirmation
Confirmation usually involves a candlestick, or a part of a candlestick, crossing a line of support or resistance. The general strategy is to wait for a full candle body, or wait for the candle to close above a line of resistance or below a line of support as confirmation. This could generate a buy or sell or short point in the stock, as it may be a sign of a breakout.
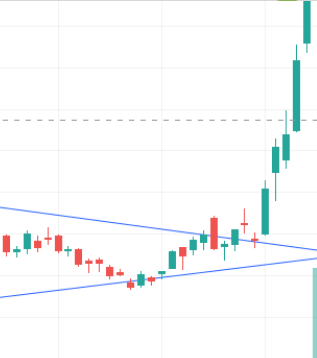
In this chart, the green candle closes above the line of resistance as a wedge has formed. The chart then pulls back but does not move past the level, and eventually breaks out.
This closing strategy is one strategy for confirmation of a breakout. Although, the strategy that the trader uses is up to the comfortability of the trader.
Volume Confirmation
Using volume as confirmation is one of the best strategies to confirm a breakout. A surge in volume, as opposed to lower volume before it, may provide confirmation for the breakout.
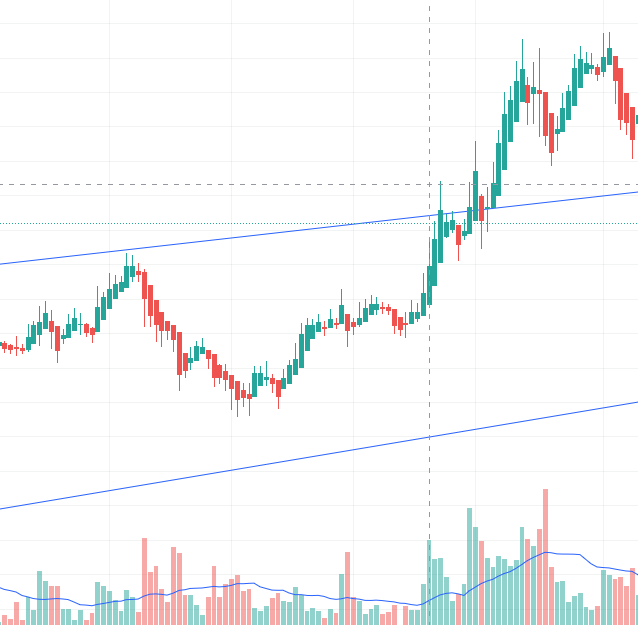
As you can see in this chart, volume spiked as the breakout was occurring. A green candle closes above the top resistance line and the volume is higher than usual on the indicator. The moving average may help traders see and analyze the different levels in volume.