
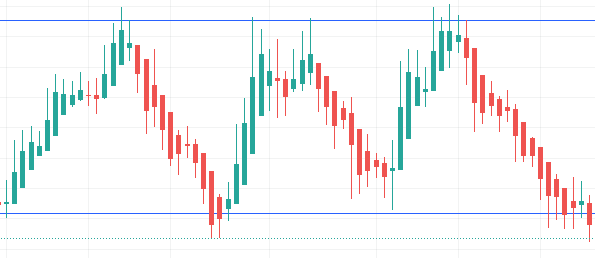
How to Trade Double Tops and Double Bottoms
The Double Pattern is pretty simple, as all of the moves associated with it just use two simple factors: Support and resistance. The Double Pattern is a fairly common pattern when it comes to technical analysis as it can indicate a potential reversal of the trend. If you can master recognizing support and resistance points […]
Guide on How to Trade the Cup and Handle Pattern

The Cup and Handle pattern is one of the most commonly discussed chart patterns in the technical analysis world. The pattern is called the Cup and Handle pattern because it resembles a cup with a handle. According to Investopedia, American William J. O’Neil defined this pattern. There are different parts associated with it and the […]
How to Trade Breakouts: Definitions, Strategies, Examples
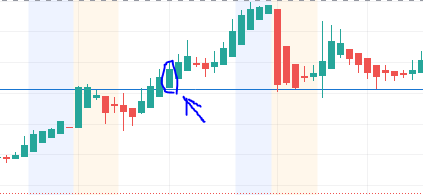
A breakout in trading is when price moves above or below an area of support or resistance. They can be bullish or bearish and can indicate a possible trend in the breakout direction. Breakouts are sometimes referred to as trendline breaks, which will most likely be categorized as either ascending or descending. Technical analysts often […]
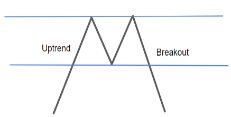
How to Trade the Diamond Pattern
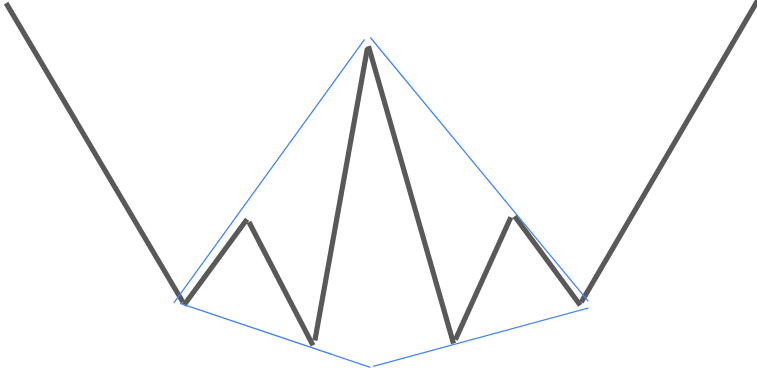
The Diamond pattern is a very distinctive pattern that utilizes the concept of support and resistance. The pattern signals a reversal of the current trend as it is very similar to a Head and Shoulders pattern. If analyzed correctly, many trading opportunities may arise during and after the pattern. Quick Notes: The Diamond Pattern Not […]
What Is Technical Analysis? – Definitions, Strategies, Examples
Technical analysis is the method of applying chart analysis and examining movements in price. Technical analysts, those who focus and study on technical analysis, use price movement, volume, and market psychology to try and predict trends. Quick Notes: How Does Technical Analysis Work? Technical analysts use concepts like chart patterns, support and resistance, indicators, and […]
What Is Support and Resistance? A Complete Guide
Support and resistance levels are points of supply or demand of the stock. The concept of support and resistance is one of the most discussed topics in technical analysis and the stock market because it leads to so many other topics like chart patterns, indicators, Elliott waves, and more. Quick Notes: What Is Support and […]
How to Read and Understand Candlesticks
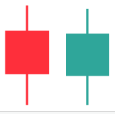
Candlesticks are a Japanese invention thought to be developed by Munehisa Homma. Candles are used in technical analysis to identify trends and patterns in a company’s stock in more detail than just a regular line chart. They represent the emotions of traders and a more detailed look at a stock’s price. For most charts, the […]
How to Know What Type of Investor You Are
TYPES OF INVESTORS: Growth Investor Investors that buy into companies that are growing quicker than the stock market is growing, AKA, thriving. Also Read – How To Predict Stock Movement: Support and Resistance Value Investor Value Investors buy into companies when the stock price of said company is lower than what they think the value […]
How To Predict Stock Movement: Support and Resistance

How Do You Predict the Future of the Stock Market? Is accurately predicting the future of the stock market 100% of the time a possibility? Well no, it’s not. Still, certain strategies can increase the likelihood of an investor’s success. Stock movement is constantly trying to be predicted by investors, traders, and software. There are […]
The Bollinger Bands® Indicator Makes Predicting the Stock Market Easy
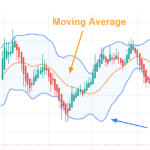
Bollinger Bands This powerful indicator may be used by traders to identify overbought or oversold signals, and can also be used to measure the volatility of the stock. It is used usually by technical analysts, those who practice technical analysis. Obviously, “Easy” in the title does not mean that trades will always work out 100% […]