
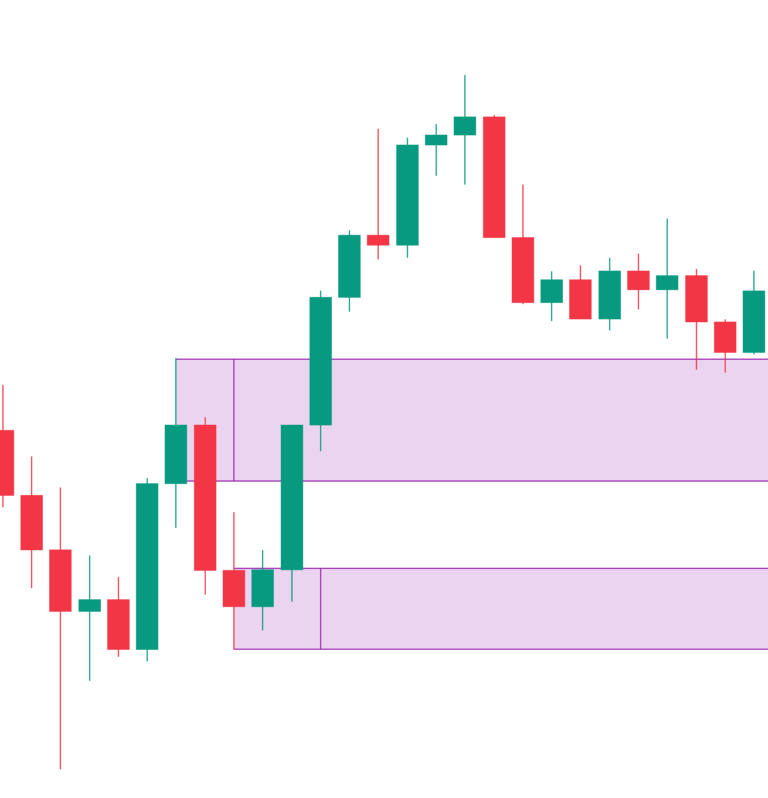
We often see new supply and demand traders mark out every zone and identify every imbalance on the chart. While this isn’t necessarily wrong technical analysis, it often leads to confusion and failed trades. This article will cover two ways of identifying possibly highly tradable supply and demand zones as opposed to zones that are […]
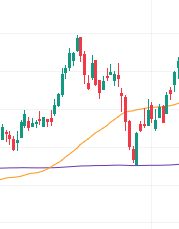
Moving averages are one of the most well-known yet unused technical indicators. They are generally used to smooth out price data and show the average price, but there are several ways that they can be used for trading. Moving averages allow traders to employ many strategies, some of which are well-known and some of which […]
Want to Learn?
-
Identifying Strong Supply and Demand Zones
-
How to Use Moving Averages for Trading
-
What Is the Pivot Machine Gun - STRAT Trading
-
How to Day Trade With the STRAT Method
-
What Is a Stop-Loss? - Definitions and Examples
-
What Is Time Frame Continuity? - STRAT Trading
-
STRAT Reversals – Explanations and Examples
-
What Is the STRAT Method?
-
How to Trade the Pipe Tops and Bottoms Chart Pattern
-
3 Popular Chart Patterns for Scalping
Join The Success Academy!
Signup for news and special offers!
Thank you!
You have successfully joined our subscriber list.