
Candlesticks are a Japanese invention thought to be developed by Munehisa Homma. Candles are used in technical analysis to identify trends and patterns in a company’s stock in more detail than just a regular line chart. They represent the emotions of traders and a more detailed look at a stock’s price.
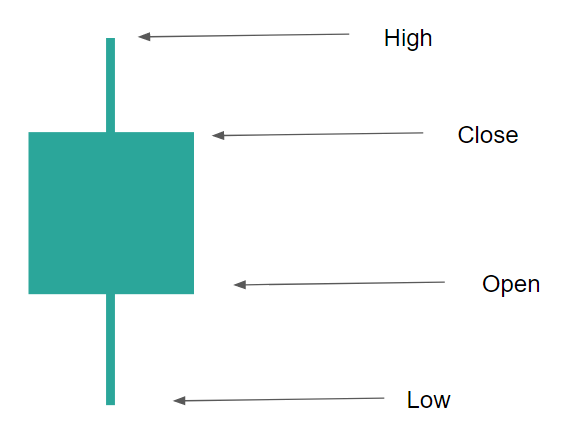
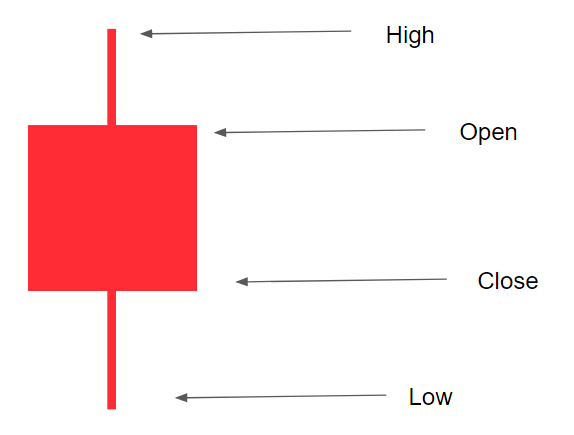
The green candlestick is considered bullish and the red candlestick is considered bearish. These candles can sometimes also be shown as white and black.
Quick Notes:
- Parts of the candlestick include the body, the wicks, the high, the low, the open, and the close.
- There are bullish and bearish candlesticks.
- A bullish candle becomes bullish when the close price is higher than the open price, representing an increasing price.
- A bearish candle becomes bearish when the close price is lower than the open price, representing a decreasing price.
Also Read – Broadening Bottoms and Tops
________________
Parts of Candlesticks
A candlestick has various parts such as the wicks, the body, the high, the low, the open, and the close points.
The Body: The body is the main rectangular part of the candlestick, often between the two wicks.
The Wicks: The wicks are the lines, often seen on the top and the bottom of candles.
The High: The highest point the price reached during that specific candlestick.
The Low: The lowest point the price reached during that specific candlestick.
The Open: The price at which the candle started at the beginning of its time frame.
The Close: The price at which the candle ended at the end of its time frame.
Bearish VS Bullish Candlesticks
The bullish and the bearish candlesticks are slightly different in terms of parts.
A bullish candle becomes bullish when the close price is higher than the open price, representing an increasing price.
A bearish candle becomes bearish when the close price is lower than the open price, representing a decreasing price.
Candlesticks may act as a foundation for analyzing stocks and technical analysis.
Confirmation:
Candlesticks also are very useful in the confirmation of a breakout.
Traders, when watching a potential breakout, usually have a way to distinguish a breakout from a test and a bounce. This is called confirmation.
The trader may look for confirmation on a potential breakout and it can depend on the trader.
Candlestick Confirmation
Confirmation usually involves a candlestick, or a part of a candlestick, crossing a line of support or resistance. The general strategy is to wait for a full candle body, or wait for the candle to close above a line of resistance or below a line of support as confirmation. This could generate a buy or sell or short point in the stock, as it may be a sign of a breakout.
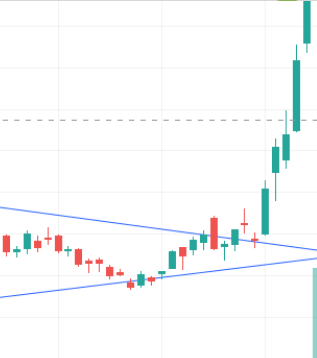
In this chart, the green candle closes above the line of resistance as a wedge has formed. The chart then pulls back but does not move past the level, and eventually breaks out.
This closing strategy is one strategy for confirmation of a breakout. Although, the strategy that the trader uses is up to the comfortability of the trader.
Where to Find Candlestick Charts
Most charting platforms have some type of candlestick feature, but here are some popular charting platforms:
TradingView
TradingView is one of the most popular online, free, and compact charting platforms. To view a stock with a candlestick chart, enter the stock’s name or ticker in the search bar and press enter. Then, press the button in the top left, next to the “Indicators” button that looks like this:

Then, press on “Candles”. Some may prefer to use the Heikin Ashi candles, as they may seem simpler.
Yahoo Finance
Another popular online charting software, powered by Yahoo. To access the candlestick chart, search up a ticker in the top search bar of the homepage, double click on the area chart, press the button that looks like this:

And choose “Candle”.
Stock Charts
Stock Charts may be a bit confusing for beginners, but it is very compact with features. To access a candlestick chart, search up a ticker in the search bar, and wallah, a candlestick chart has appeared. You can change the settings as you wish.