
In the mathematical world, the Fibonacci sequence is one of the most famous and fascinating sequence of numbers. It is used for many equations, and is seen in many unexpected places like a sunflower seed pattern.
The sequence is thought to be originated from Leonardo Fibonacci, an Italian man from Pisa, Italy. It actually has been dated back to Ancient India. According to Investopedia, “Indian mathematician Acarya Virahanka is known to have developed Fibonacci numbers and the method of their sequencing around 600 AD.” Leonardo then shared the sequence with western Europe.
The sequence goes as follows: 0, 1, 1, 2, 3, 5, 8, 13, 21, 34, 55, and so on, with every number after the first 2 being the sum of the 2 preceding numbers.
In trading, a retracement calculator creates Fibonacci Lines which are used as support and resistance price levels on the chart. The most focused on levels are the .5 and the .618 levels because they are often strong areas of support and resistance. So, if a stock were to cross one of those, it would probably change the trader’s outlook on the stock. This begs the question, how do traders use the Fibonacci sequence on a chart?
Fibonacci Tools
There are many Fibonacci tools and indicators used by traders, but these are four powerful and common ones:
- Fibonacci Retracements
- Fibonacci Arcs
- Fibonacci Fans
- Fibonacci Time Zones
Each of these tools can be utilized to further technical analysis strategies.
Fibonacci Retracement
A Fibonacci retracement tool is one of the most common tools used by technical analysts who perform Fibonacci analysis. A “Fibonacci retracement” can refer to either a specific retracement tool, like the one shown here, or a Fibonacci retracement in general.
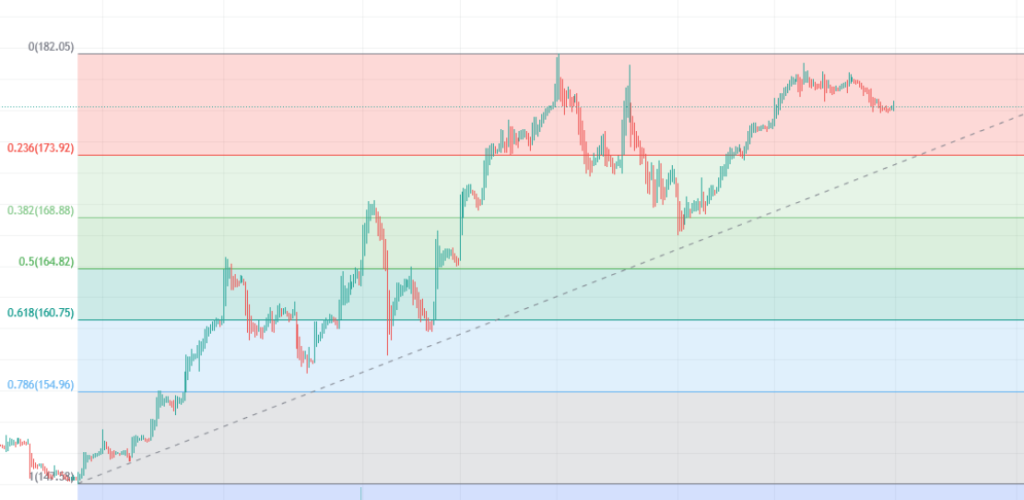
In this retracement tool, notice how the chart forms around these levels in some areas. These levels act like levels of support and resistance, with the 0.5% and the 0.618% generally being the strongest.
It is important to note that out of all of the Fibonacci ratios, 23.6%, 38.2%, 61.8%, and 78.6%, 50% is not considered an actual Fibonacci ratio.
To use this retracement tool, first, find a low, and a high. They should be extreme lows and highs of the charting area. Then, click on the low point, and go all the way to the right of the graph and to the high point, and click there.
Other charting platforms may use this retracement tool differently.
Fibonacci Arc
The Fibonacci arc is another tool that is commonly used by traders. Like the above retracement tool, it has the same ratios.
These arcs are half circles that extend from one extreme point to another. You can see the trend line in the picture, as well as the points.
A Fibonacci arc is usually used by traders who are looking at a decline or incline in price and want to map out the possible significant support and resistance levels on the chart.
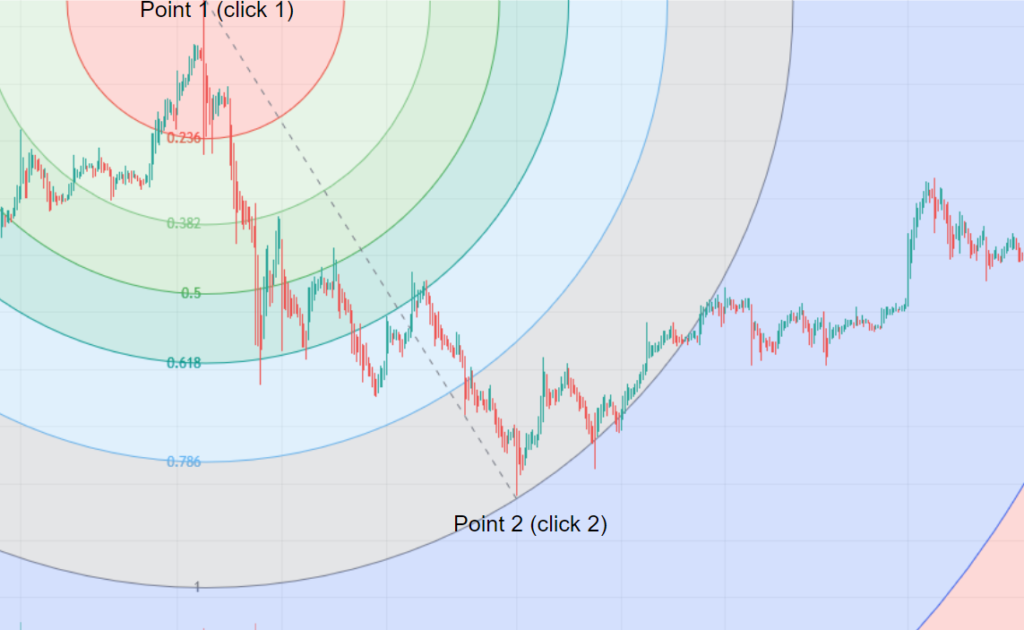
To use a Fibonacci arc, find an extreme high and an extreme low. In this case, the first click is a high and the second click is a low. This will form the arc.
In the chart, price consolidates more in 0.5% to 0.618% range than in other areas. This is because these two percentages are usually seen as more significant levels of support and resistance than other percentages.
Fibonacci Fan
The Fibonacci fan is just like the other retracements. It has the same numbers, and it is used practically the same way.
A Fibonacci fan sometimes displays 0.25% instead of 0.236%.
Traders may use Fibonacci fans during a channel, where the price is increasing or decreasing in sort of a “route.”
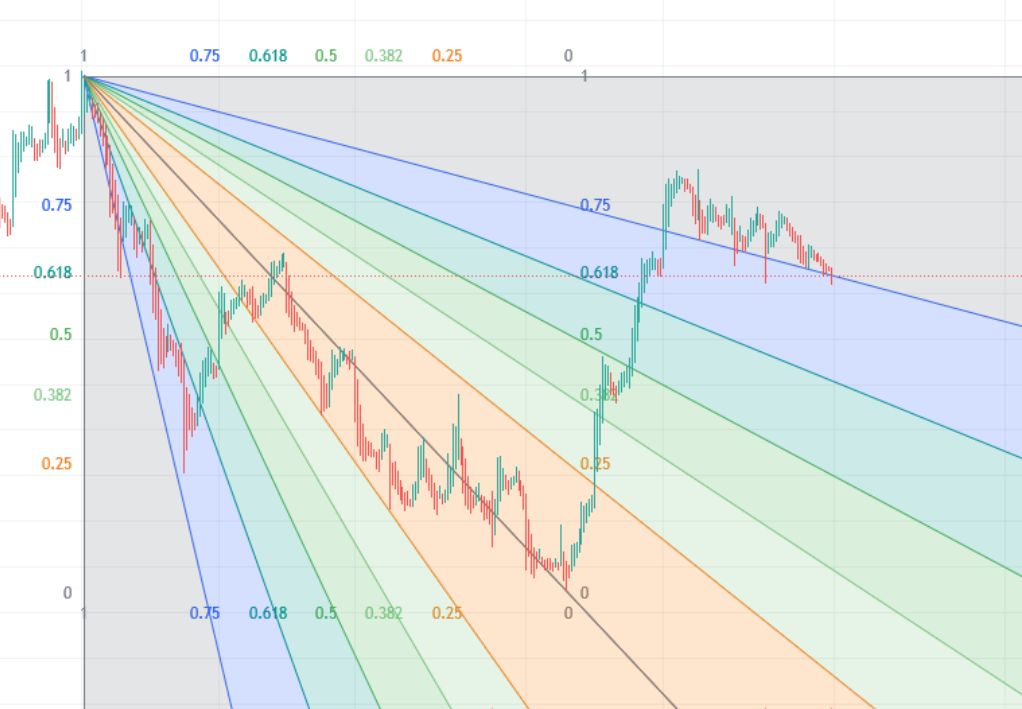
To use the Fibonacci fan, find either the first extreme low or extreme high, click there, and then click on the opposite extreme. In this chart, it would be extreme high to extreme low.
Fibonacci Time Zones
Time zones can be very interesting and can be very useful, but do not rely solely on a Fibonacci time zone, as it isn’t perfect.
At the point of a time zone indicator (one of the blue lines), the chart may reverse directions. As you can see in the picture, the chart either reverses directions on the time zone indicator or very close.
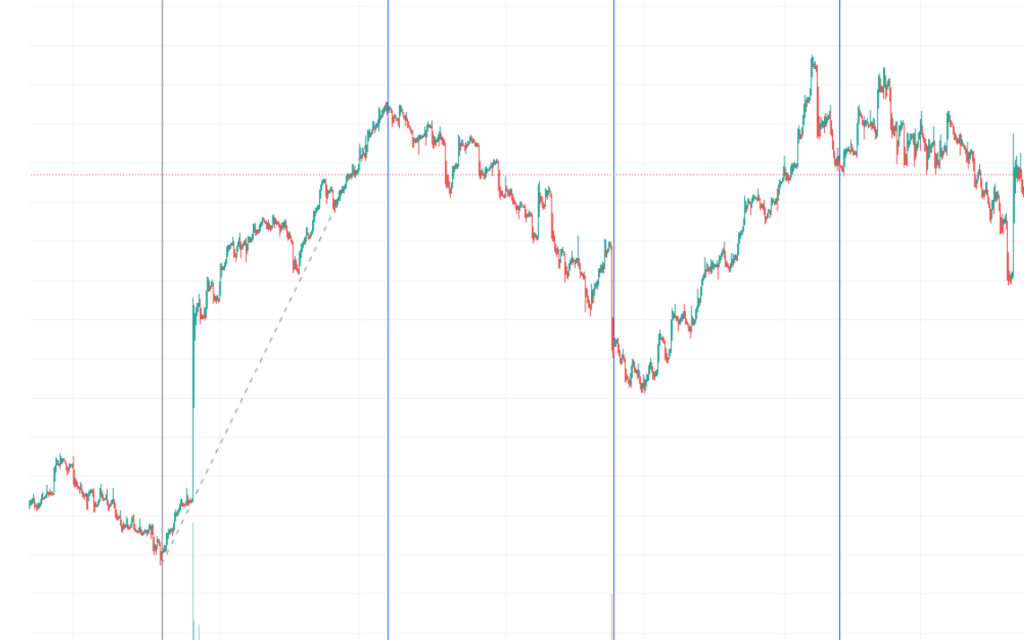
To use this tool, find two extremes. In this case, an extreme low and an extreme high.
Fibonacci Trading Strategies
There are many strategies that traders may use to trade with Fibonacci tools. These strategies not only depend on the placement of a retracement, but also on the time frame.
Fibonacci retracements can be utilized across many time frames, but traders generally considered more accurate the longer the time frame is.
The Fibonacci and MACD Strategy
This interesting yet simple strategy uses the Fibonacci levels with the Moving Average Convergence Divergence (MACD) indicator to find potential trend continuations and thus, trading opportunities.
Where To Find Fibonacci Tools
Most charting platforms have some type of candlestick feature, but here are some popular charting platforms:
TradingView
TradingView is one of the most popular online, free, and compact charting platforms. To view a stock with a candlestick chart, enter the stock’s name or ticker in the search bar and press enter. Then, press the button in the top left, next to the “Indicators” button that looks like this:

Then, press on “Candles”. Some may prefer to use the Heikin Ashi candles discussed above, as they may seem simpler.